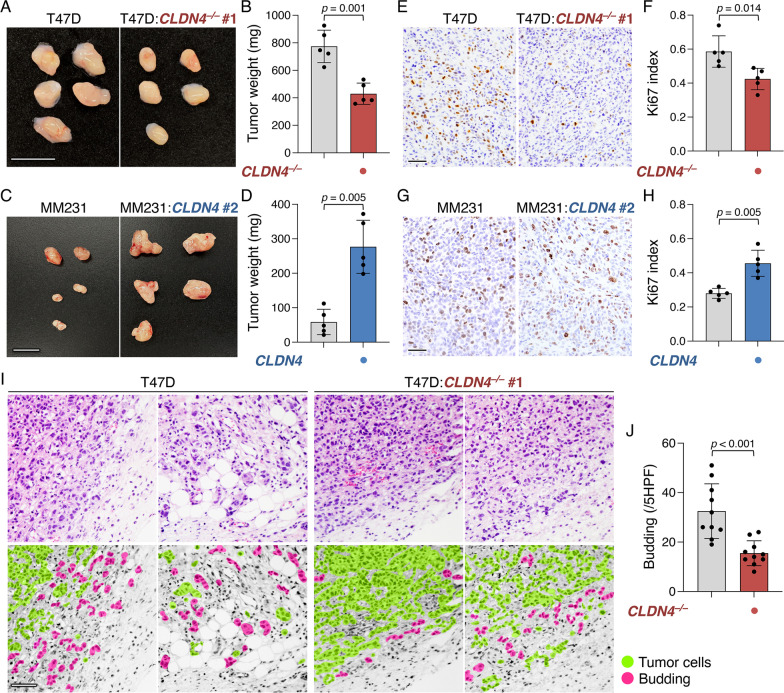
Fig. 2.
CLDN4 advances the malignant behavior of breast cancer cells in vivo. A–D Gross appearance and weight of the indicated xenografts at 28 days after the inoculation. T47D:CLDN4–/– clone #1 and MDA-MB-231:CLDN4 batch #2 were used for xenograft experiments. The tumor weight is plotted and shown in histograms (mean ± SD; n = 5). Similar results were obtained from xenograft experiments using different T47D:CLDN4–/– clones and MDA-MB-231:CLDN4 batches. E–H Typical images and quantification of Ki-67 labeling assay of the indicated xenografts. Ki-67 index is plotted and shown in the histograms (mean ± SD; n = 5). I Microscopic appearance of T47D and T47D:CLDN4–/– xenografts. The regions corresponding to the xenograft tumors and the surrounding fibrous capsule are indicated. J Quantification of budding in T47D and T47D:CLDN4–/– xenografts. The budding number is plotted and shown in the histograms (mean ± SD; n = 10). MM231, MDA-MB-231; HPF, high-power field. Scale bars, 1 cm (A, C); 100 μm (E, G, I)

