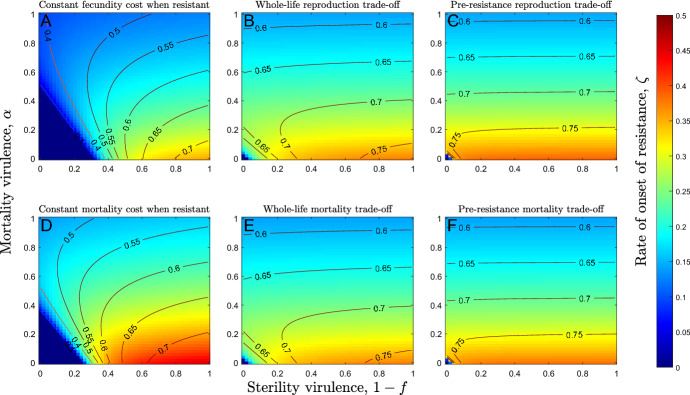
Fig. 4.
Heatmaps showing the evolved rate of onset of resistance as mortality and sterility virulence vary and for qualitatively different trade-offs. Contours show the proportion of the host population that is resistant to the disease and so do not correspond to heatmap colours. The rate of onset of resistance is highest (red) when mortality virulence is low and sterility virulence is high (bottom right of each panel). Increasing sterility virulence (left to right within each panel) always causes the rate of onset of resistance to increase. Increasing mortality virulence (bottom to top within each panel) may also cause the rate of onset of resistance to rise and then fall for sufficiently low values of sterility virulence. These patterns are broadly consistent across all six trade-off scenarios (a–f). Parameters used are as in Table 1, except (accelerating costs), and , where applicable

