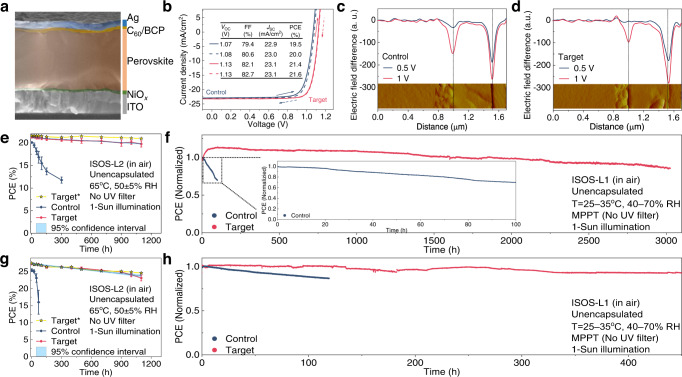
Fig. 4. Device performance and stability.
a Cross-sectional SEM image of the single-junction PSC. b J–V curves of the best-performing control (navy) and target (red) devices, in forward scan (solid lines) and reverse scan (dotted lines). The inset table shows the corresponding efficiency parameters. c, d AFM cross-section images (inset) and electric field differences across the whole control (c) device and target (d) device, taken by the first derivative in potential differences with respect to the zero bias. e ISOS-L2 measurements of unencapsulated devices. The target champion cell (denoted with*) is indicated with yellow stars (surrounded by black border lines). Standard deviation (error bar) is calculated from six individual devices in the same batch. The 95% confidence interval for the stability of the target devices is shown as a blue band. f The operational stability of the unencapsulated control and target single-junction devices under MPPT in air. g ISOS-L2 measurements of unencapsulated tandem devices. The target champion tandem cell (denoted with*) is indicated with yellow stars (surrounded by black border lines). Standard deviation is calculated from six individual devices in the same batch. The 95% confidence interval for the stability of the target tandem devices is shown as a blue band. h MPPT of the unencapsulated control and target tandem devices in air.

