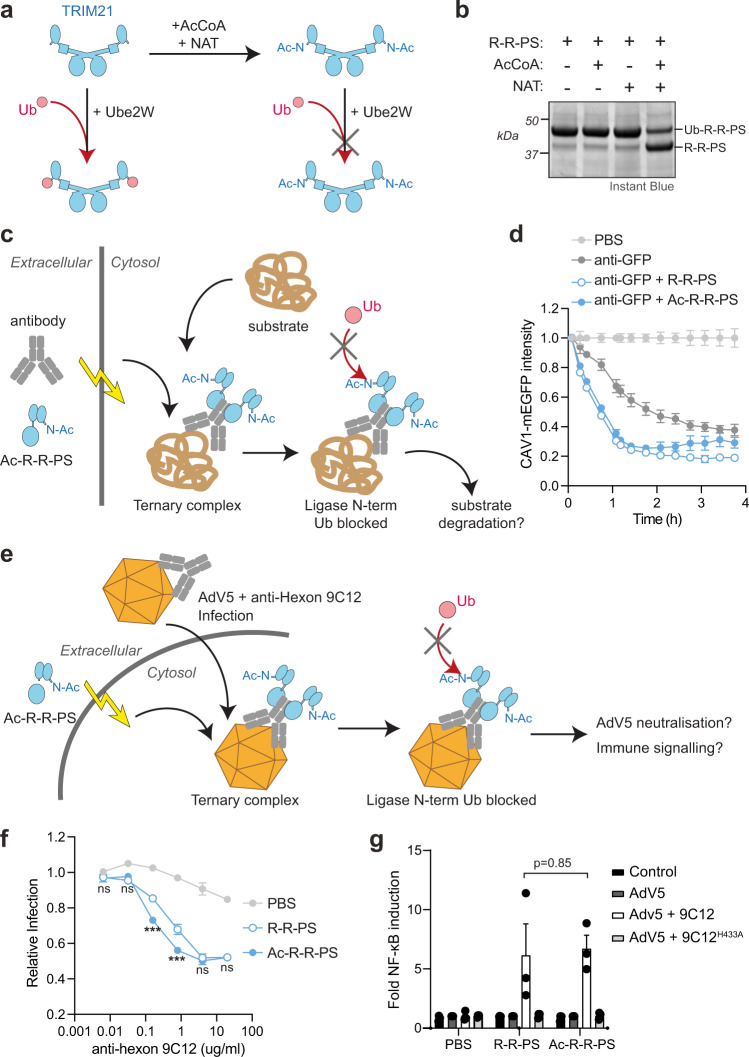
Fig. 2. Ligase N-terminal ubiquitination is not required for substrate degradation and antiviral activity.
a Schematic showing N-terminal acetylation of TRIM21 by AcCoA and NAT and then incubation of the acetylated or unmodified ligase with ubiquitin (Ub) and Ube2W in a ubiquitination reaction. b Protein-stained gel of ubiquitination reaction depicted in (a) using R-R-PS ligase. Monoubiquitination of R-R-PS that has been incubated with AcCoA and NAT is inhibited. Representative example from n = 3 independent experiments. c Schematic showing Trim-Away experiment in which antibody is electroporated into cells together with Ac-R-R-PS. Once inside cells, a ternary complex with the substrate is formed. If degradation is driven by ligase N-terminal ubiquitination, then Ac-R-R-PS activity will be inhibited. d Results of Trim-Away experiment described in (c). RPE-1 CAV1-mEGFP cells were electroporated with PBS or anti-GFP antibody ± R-R-PS proteins and CAV1-mEGFP fluorescence was quantified using the IncuCyte system. Time shows hours (h) post-electroporation. Values normalized to PBS control condition. Graphs shows mean and s.e.m. from n = 4 technical replicates. Representative example from n = 2 independent experiments. Note that there is CAV1-mEGFP degradation with anti-GFP alone due to the presence of endogenous cellular TRIM21. e Schematic showing electroporation of Ac-R-R-PS into cells followed by infection with Adv5 in the presence of anti-hexon antibody 9C12. If ligase N-terminal ubiquitination is necessary for TRIM21 antiviral function, neutralization of infection and immune signaling will be inhibited. f, g Neutralization of AdV5 infection by increasing 9C12 concentrations (f) and AdV5-9C12-induced NFκB activation (g) in HEK293T TRIM21 KO cells infected immediately after electroporation with PBS or R-R-PS ± acetylation. 9C12H433A does not bind TRIM21 PRYSPRY. Graphs shows mean and s.e.m. from n = 3 independent experiments. Black dots in (g) show individual data points. Statistical significance between R-R-PS and Ac-R-R-PS is based on two-way ANOVA (f; significance is represented with labels ns (not significant, P > 0.05), *** (P ≤ 0.001)) and two-tailed Student’s t test (g). Source data are provided as a Source Data file.

