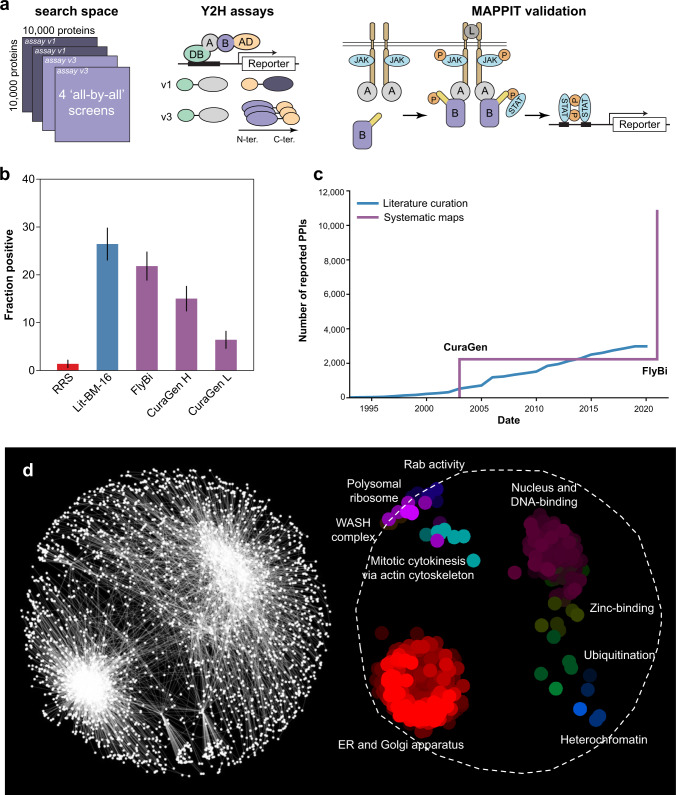
Fig. 1. Large-scale, all-by-all binary interaction screens of 10,000 Drosophila proteins.
a Schematic of the systematic screening pipeline. Left, the search space covered and the Y2H assay versions used. Center, assay versions used in the Y2H screen. Right, MAPPIT validation assay. b Fraction of pairs positive in the MAPPIT validation assay for the following sets: random reference set (RRS; n = 216; red), literature-curated binary pairs with multiple evidence (at the time of the assay; Lit-BM-16; n = 123; blue), FlyBi pairs (n = 193; purple), and CuraGen pairs at high (H; n = 193) and low (L; n = 187) cutoff values as defined by Giot, Bader et al. 2003 (purple). Error bars shown as fraction of positives ± standard error of the proportion. c Total number of binary interactions in literature and systematic interactome maps over the past 20 years. Blue line, gradual increase in the total number of binary interactions accumulated in the literature (Lit-BM), displayed based on date of publication. Purple line, total number of interactions from systematic interactome mapping efforts based on the date of public release of systematic binary datasets. d Network-based spatial enrichment analysis (SAFE) results for the FlyBi dataset. Clusters of genes enriched for gene ontology (GO) terms are highlighted. The different colors highlight different enriched groups. Source data are provided in Supplementary Files 1–6. We note that panel a of this figure comprises modified versions of Fig. 1a, b in Luck, K., Kim, DK., Lambourne, L. et al. “A reference map of the human binary protein interactome.” Nature 580, 402–408 (2020) 10.1038/s41586-020-2188-x and Fig. 2b in Braun, P., Tasan, M., Dreze, M. et al. “An experimentally derived confidence score for binary protein-protein interactions.” Nat Methods 6, 91–97 (2009) 10.1038/nmeth.1281.

