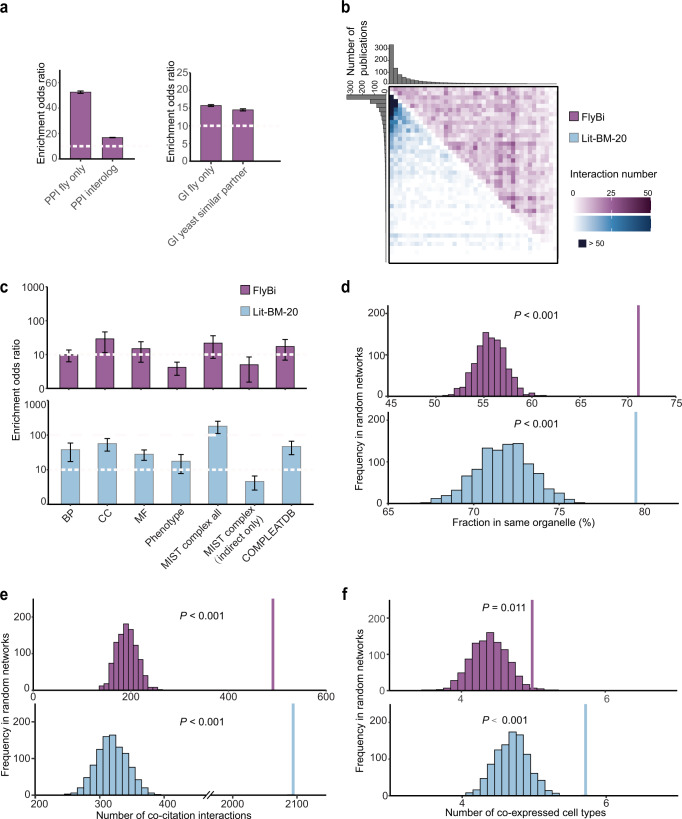
Fig. 2. Bioinformatics analysis of the FlyBi Y2H dataset.
a Comparison of FlyBi with protein-protein and genetic interactions (PPIs and GIs) from MIST. Fraction of FlyBi pairs overlapping with published Drosophila PPIs or interologs (putative PPIs based on orthologous genes in other organisms) analyzed by comparison to 1000 random networks generated by node shuffling. FlyBi dataset is enriched for published PPIs. Overlap with Drosophila GIs and gene pairs with similar GIs in yeast were also analyzed. b Adjacency matrix for binary interactions in literature with multiple lines of evidence (Lit-BM; light blue) and FlyBi interactions (purple). Proteins binned and ordered along axes based on number of corresponding publications. Color intensity of each square reflects total number of interactions between proteins in corresponding bins. c–f Biological significance analyses. Purple, FlyBi; light blue, Lit-BM. c Enrichment of binary interactome maps for functional relationships and co-complex memberships. BP Biological process, CC Cellular component, MF Molecular function; Phenotype, shared phenotypes as annotated by FlyBase; MIST complex all, all annotated indirect interactions in MIST (might or might not be supported by direct evidence); MIST complex only indirect, all interactions annotated as supported only by indirect evidence in MIST; COMPLEATDB, complex annotations (literature-based complexes only). Dashed white line, reference for comparison of bar heights. For a, c, means ± standard errors of the means (SEM) are shown. For d–f, single bar on right shows results for FlyBi (purple) or Lit-BM (blue); multiple bars on left show results for 1000 randomized networks. d Co-localization analysis. Shown, fraction of interacting partners sharing the same organelle annotation, compared with results for 1000 randomized networks. Organelle annotations as predicted by PSORT and DeepLoc. e Co-citation analysis. Shown are numbers of interacting partners cited in the same publication(s), compared with results for 1000 randomized networks. Only publications associated with < 100 genes considered. f Co-expression analysis. Shown is average number of co-expressed cell types defined by cluster analysis of a single-cell RNAseq dataset for Drosophila midgut, compared to results with 1000 randomized networks. Statistical information is provided in Supplemental Notes. Source data are provided in Supplementary files 1–6.

