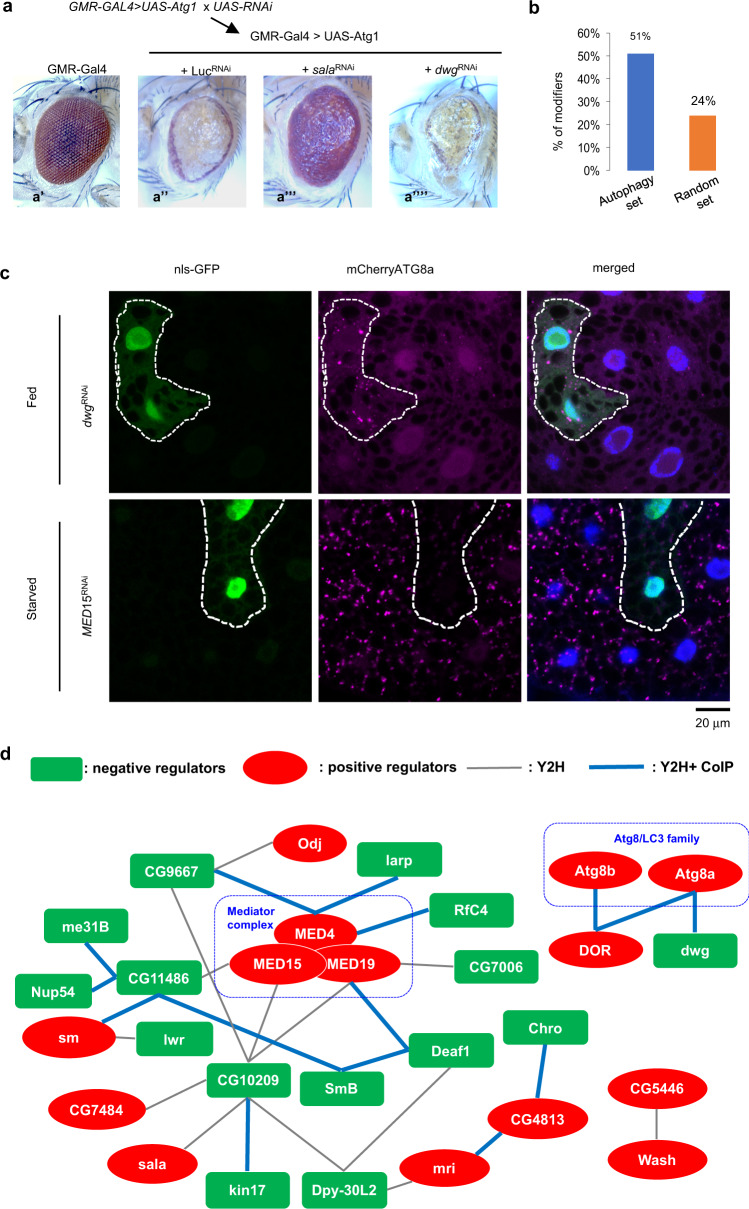
Fig. 3. Identification of an autophagy regulatory network using the FlyBi dataset.
a Genetic cross and example phenotypes for RNAi knockdown in the presence of Atg1 over-expression. Two sets were compared: an experimental set defined based on predicted interaction in the FlyBi dataset with known autophagy components or their interactions (Supplementary Data 8) and a randomly selected set. a’-a””. Representative adult Drosophila eye phenotypes from control and experimental assays for modification of the Atg1 overexpression phenotype. a’, Gal4-only control. a”, Ectopic expression of Atg1 using the eye-specific GMR-GAL4 driver results in a rough eye and reduced eye size. The effect is reduced in the presence of SalaRNAi (a”’) and more severe in the presence of dwgRNAi (a””). b Percentage of RNAi lines that behaved as putative genetic modifiers of Atg1 over-expression. c Distribution of mCherry-ATG8a in the larval fat body (fed or starved conditions). Clonal expression of dwgRNAi (GFP-labeled cells, top panels) induced formation of mCherry-ATG8a puncta under fed conditions whereas clonal expression of MED15RNAi (GFP-labeled cells, bottom panels) abrogated starvation-induced Atg8a puncta. Experiments were repeated three times independently with similar results. Scale bar: 20 μm. d Putative autophagy regulator network based on knockdown, FlyBi data, and co-immunoprecipitation (co-IP) data (see Supplementary Figs. 5, 6). Green boxes, putative suppressors of autophagy; red ovals, putative inducers of autophagy; thin grey edges, direct interactions as reported in the FlyBi dataset; thicker blue edges, interactions reported in FlyBi and confirmed by co-IP. Of the genes in the network, 6 (30% of total) computed relatively unstudied genes (CGs) were added to the network by our studies. Source data are provided in Supplementary Data 8 and as a Source Data file.

