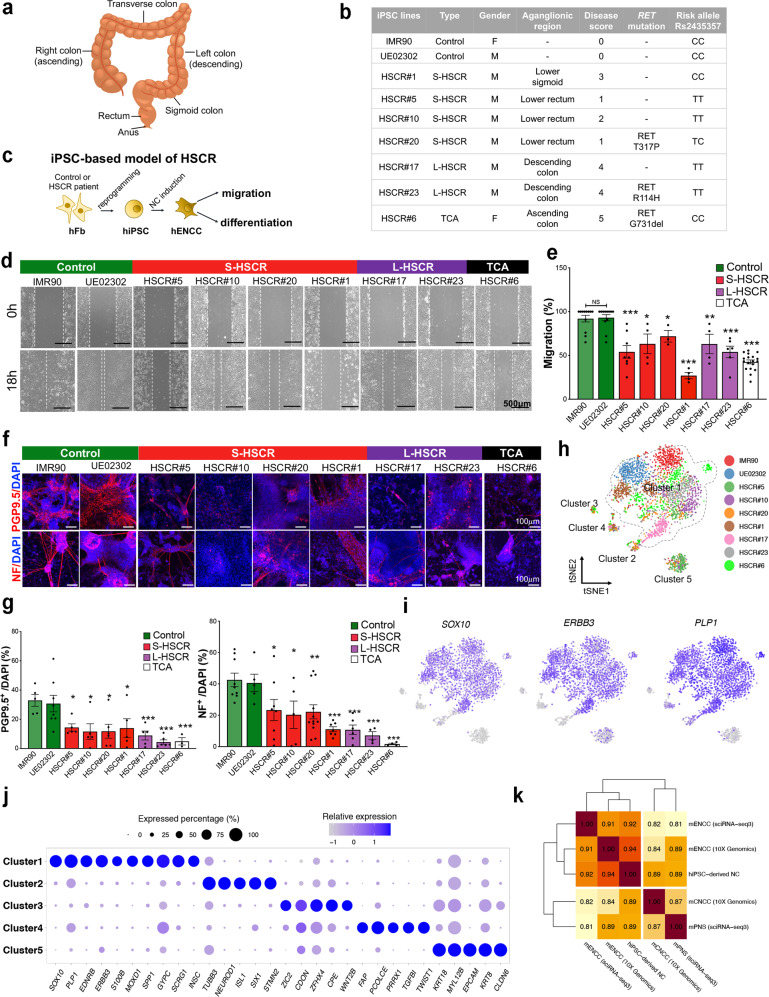
Fig. 1. Functional and molecular characterization of an iPSC-based model of HSCR.
a Anatomy of the human colon. b An overview of healthy and HSCR-iPSC lines used in this study. c Schematic shows the recapitulation of disease phenotypes using HSCR-iPSC lines. d In vitro scratch assay. e Bar chart shows the quantitative data of migration. Data were presented as mean values ± SEM from 3–18 independent experiments. f In vitro differentiation assay with two neuronal markers (PGP9.5 and NF) and g the corresponding quantitative analyses. Data are presented as mean values ± SEM from 3–12 independent experiments. e, g One-way ANOVA was used for the statistical analyses. Bars marked by “***”, “**”, and “*” represent they are statistically different from the controls of P values <0.001, <0.01, and <0.05, respectively. NS not significantly different. h t-SNE projection of all 3342 individual cells based on the expression of markers of shared clusters, colored by iPSC lines. Five main clusters are labeled and Cluster 1 is marked with a dotted line. i Canonical markers expressed in Cluster 1. j Dot-plot shows top key markers expressed in each cluster. The color of the dot indicates the relative expression and the size of the dot indicates the expressed percentage. k Correlation heatmap shows the similarities between human iPSC-derived NC cells and mouse in vivo enteric/non-enteric NC cells at E13.5 from two independent datasets. Sequencing platforms of datasets are noted. Source data are provided as a Source Data file.

