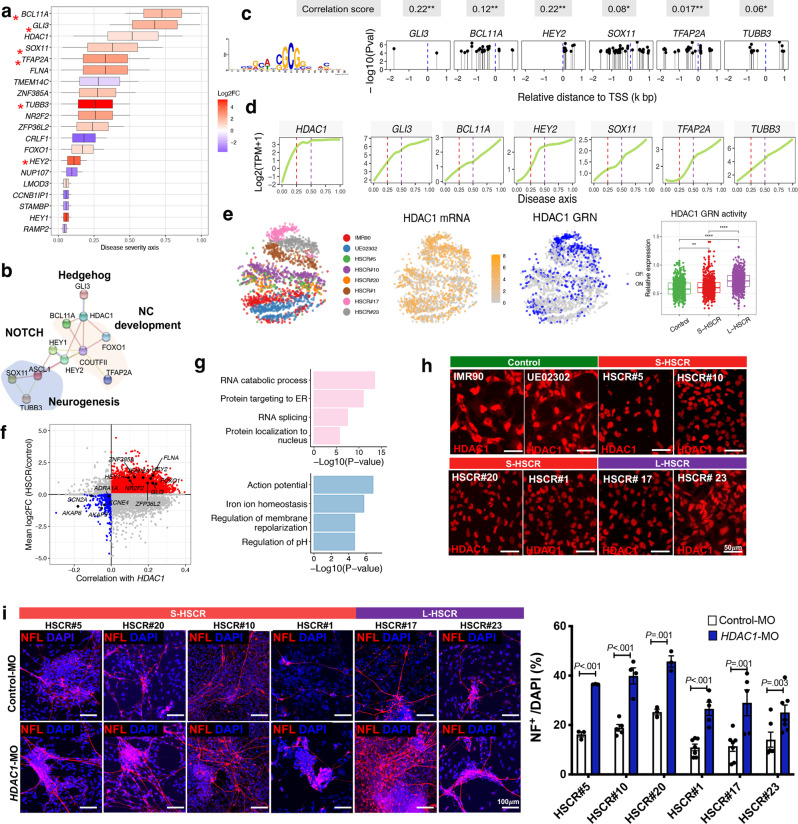
Fig. 3. Identification of a functionally enriched gene set and HDAC1 as a key regulator along HSCR severity axis.
a Anchoring of the functionally enriched gene set to severity axis with 2136 cells, colored by log2 fold-change (Log2FC) and HDAC1 targets are marked by asterisks. Log2FC was calculated by comparing all HSCR cases to two controls. Box indicates the confidence interval of activated (red) or repressed (blue) ‘period’ at the severity axis for each gene. b Protein–protein interaction (PPI) network of the core gene set. NC, neural crest. c Motif enrichment of HDAC1 at the promoter region (−2 to 1 kb relative to TSS) of its target genes. HDAC1 DNA-binding motif is shown in the left panel. TSS transcription start site. P values (Pval) were calculated by meme FIMO software. d Dynamic expression of HDAC1 and its activated target genes along the disease severity axis. Gene expression (log2(TPM + 1)) was used to fit the smooth line using all 2136 cells. TPM, Transcript per million. Correlations between HDAC1 and its target genes are shown at the bottom panel (calculated by the R cor function). The significance of the correlation testing are marked by an asterisk. P values <0.05 and <0.001 are marked by * and **. e t-SNE projection of cells based on GRN analysis. mRNA (yellow) and binary regulon activity (active (blue) or inactive (gray)) inferred by SCENIC are shown. The overall activities of HDAC1 targeted GRN in control and S/L-HSCR are shown in the boxplot. t-SNE was generated based on overall regulon activities from the SCENIC analysis. A two-sided Wilcoxon rank-sum test was applied to calculate the significance of the difference between the two groups. All samples (two controls with 754 cells, four S-HSCR with 949 cells, and two L-HSCR with 433 cells) were included for comparison and presented as groups. Boxplot represents the interquartile range (showing median, 25th and 75th percentile, and 1.5. the interquartile range). Tests marked by “****” and “**” represent they are statistically different from the controls of P values <0.0001 and <0.01, respectively. ns not significantly different. In all the boxplots, each box represents the interquartile range (IQR, the range between the 25th and 75th percentile) with the mid-point of the data, whiskers indicate the upper and lower value within 1.5 times the IQR. f Scatterplot shows putative HDAC1-activated (red) and repressed (blue) targeted genes. Key genes are labeled. The distribution of the correlation between HDAC1 and other genes is shown at the top panel. g Gene ontology (GO) enrichment analyses of HDAC1-activated and repressed targeted genes. P value and FDR were calculated by clusterProfiler software. h Immunocytochemistry shows the reduced cytoplasmic HDAC1 in HSCR-ENCCs. i In vitro differentiation assays in the absence or presence of HDAC1 morpholino (HDAC1-MO, 5 μM). Cells were harvested for immunofluorescence staining on day 5 of neuronal differentiation. Data were presented as mean values ± SEM from 3–7 independent experiments. (Student’s t-test, two-sided). Source data are provided as a Source Data file.

