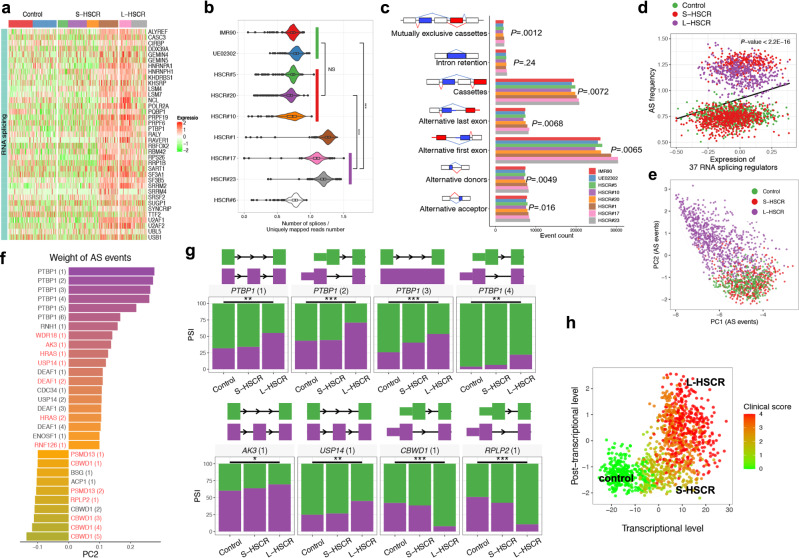
Fig. 4. Global analysis of RNA alternative splicing (AS) events in control- and HSCR-ENCCs.
a Heatmap shows the top 37 upregulated AS mediator genes enriched in HSCR#1 and L-HSCR. b Normalized number of splices in control- and HSCR-ENCCs. P values (two-sided Mann–Whitney U-test) from comparing ENCCs derived from the two controls with 754 cells and various HSCR groups (three S-HSCR with 643 cells and two L-HSCR with 433 cells) are shown. The splicing frequency of each cell was estimated by the number of splices divided by the uniquely mapped read number. Tests marked by “***” represent they are statistically different from the controls of P values <0.001. ns not significantly different. In the violin plot, each violin represents the kernel probability density of the data at different values. An inner boxplot indicates the interquartile range (IQR, the range between the 25th and 75th percentile) with the mid-point of the data. c Number of different types of RNA splicing events in control- and HSCR-ENCCs. ENCCs at high disease states (HSCR#1, 17 and 23) were compared to those in low disease states (two controls and three S-HSCR-ENCCs) (P < 0.05, two-sided t-test). d The 37 RNA-splicing regulator genes are significantly upregulated and positively correlated with AS frequency in HSCR#1- and two L-HSCR-ENCCs. All 2136 cells were included to fit the linear regression. P value shows the significance of the fitting (calculated by R lm function). e PCA projection of single cells based on AS events reveals that PC2 is highly associated with disease severity. f Top AS events positively and negatively contributed to PC2. Putative targets of PTBP1 (1) (Inclusion of exon 9) are labeled in red. g Significant differentially splicing events between control and S/L-HSCR (two-sided t-test). Two controls, four S-HSCR, and two L-HSCR were included for comparison, where a single PSI value was calculated for each sample. P values <0.05 and <0.001 are marked by ** and ***. h Transcriptional (gene expression) and post-transcriptional (RNA splicing) levels represent two complementary dimensions describing the progression of HSCR disease. PCs described in Figs. 2c and 4f were selected to represent the transcriptional (gene expression) and post-transcriptional (RNA splicing) levels of cells.

