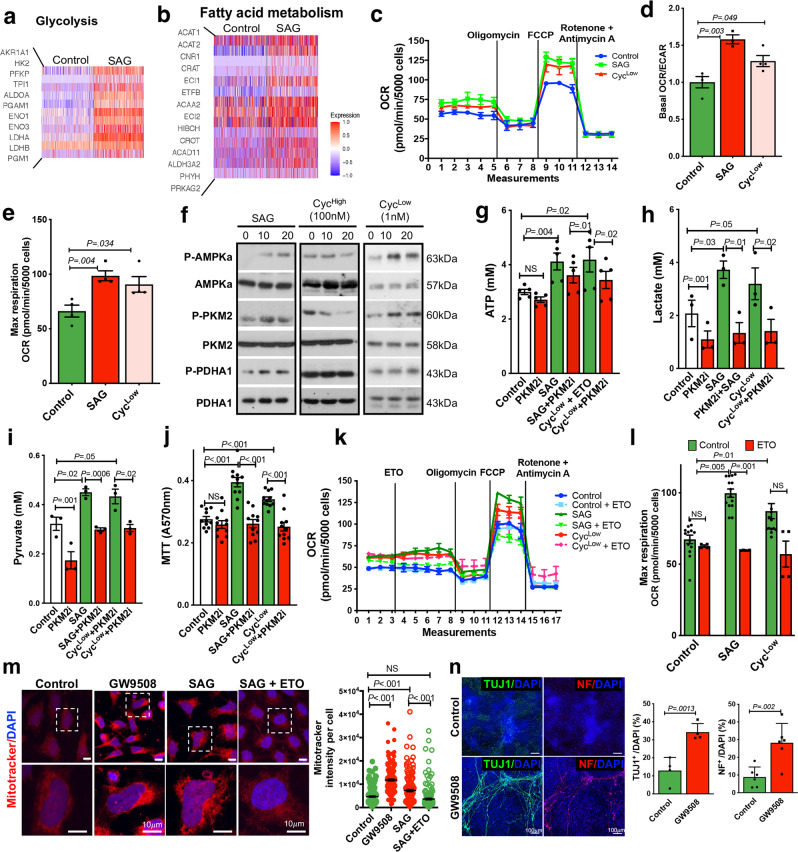
Fig. 6. Hedgehog-induced metabolic shift in ENCCs.
Heatmaps show genes implicated in a glycolysis and b fatty acid metabolism pathways in ENCCs upon the SAG treatment. c Seahorse assays of control-ENCCs treated with SAG or cyclopamine (1 nM, CycLow). (Mean ± SEM, n = 4). Dot plots from three independent experiments show the changes in d the basal oxygen consumption rate (OCR) to extracellular acidification rate (ECAR) ratios and e the maximum respiration rates upon different treatments (mean ± SEM, n = 4, Student’s t-test, two-sided). f Western blot shows the alternations of AMPK-PKM2-PDHA1 pathway in ENCCs subjected to SAG, cyclopamine (100 nM, Cychigh and 1 nM, CycLow) treatments. Representative images from three independent analyses are shown. The samples were derived from the same experiment, and the gels/blots were processed in parallel. Bar charts show g ATP (n = 5), h lactate (n = 3), i pyruvate (n = 3), and j MTT (n = 11) assays in the presence or absence of SAG or CycLow. Bar charts show the mean values ± SEM from independent experiments (Student’s t-test, two-sided). k Seahorse assays of ENCCs treated with SAG and CycLow in the absence or presence of FAO inhibitor (Etomoxir, ETO). Means of OCR ± SEM from three independent experiments are shown. l Bar chart shows the maximum respiration rates (mean ± SEM, n = 4, Student’s t-test, two-sided). m Mitochondria activities in ENCCs were monitored using the Mitotracker assay. The black line marks the mean values ± SEM from four independent experiments. n Immunocytochemistry of TUJ1+ and NF+ neurons in day 5 of neuronal differentiation. Bar charts show the mean values ± SEM from 4–6 independent experiments (Student’s t-test, two-sided). Source data are provided as a Source Data file.

