
Figure 3. VE303 Strain Colonization and Fecal Microbiome Diversity.
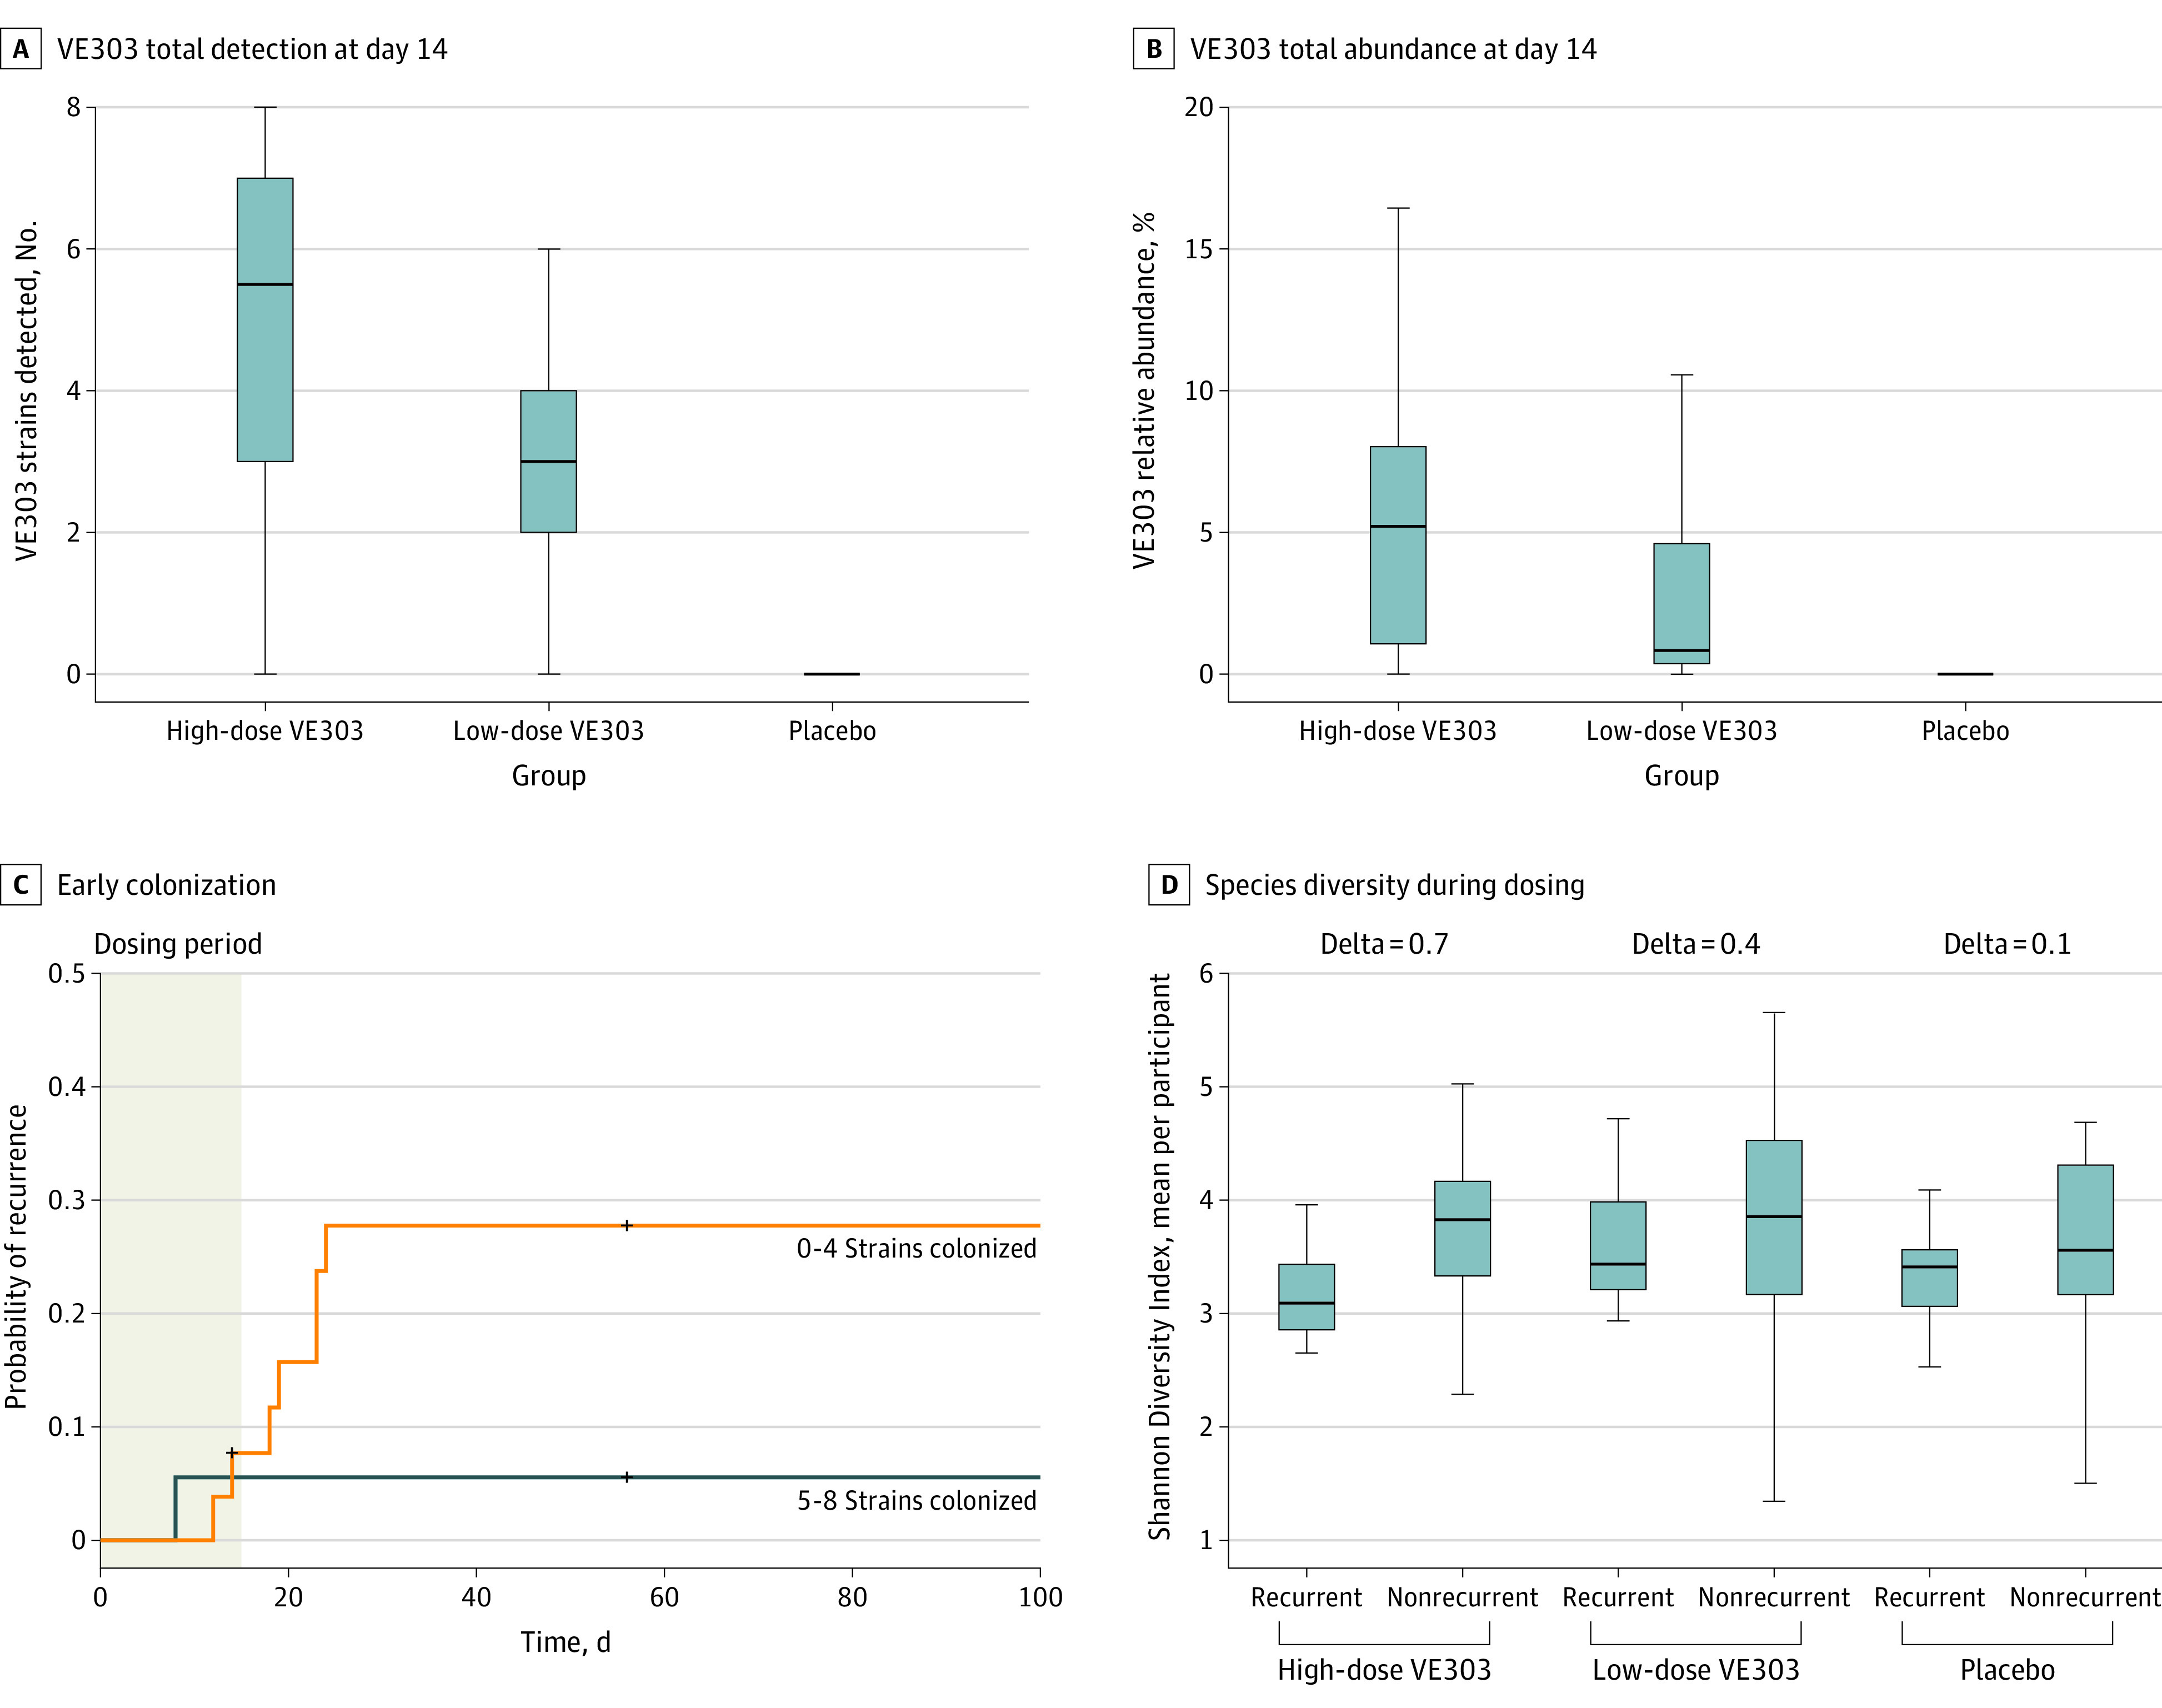
Total VE303 strain detection (A) and total VE303 strain relative abundance (B) at the end of dosing were significantly increased in VE303-dosed groups compared with the placebo group (P < .001, Wilcoxon test). C, In VE303 recipients, higher colonization (5 to 8 strains colonized) at the end of dosing was associated with a lower Clostridioides difficile infection recurrence rate and lower probability of recurrence (log-rank test, P = .08, hazard ratio for low colonization/high colonization = 5.32). D, Species alpha diversity during the 2 weeks after antibiotic treatment, shown as the time-averaged Shannon Diversity Index per participant, was associated with clinical efficacy (P = .02, linear mixed-effects model for all treatment groups). All individual participants are plotted. The box-and-whisker plots depict the median (lines within the boxes), IQR (top and bottom of the boxes), and reasonable extreme values at 1.5 × IQR in the data set (where the vertical lines end).