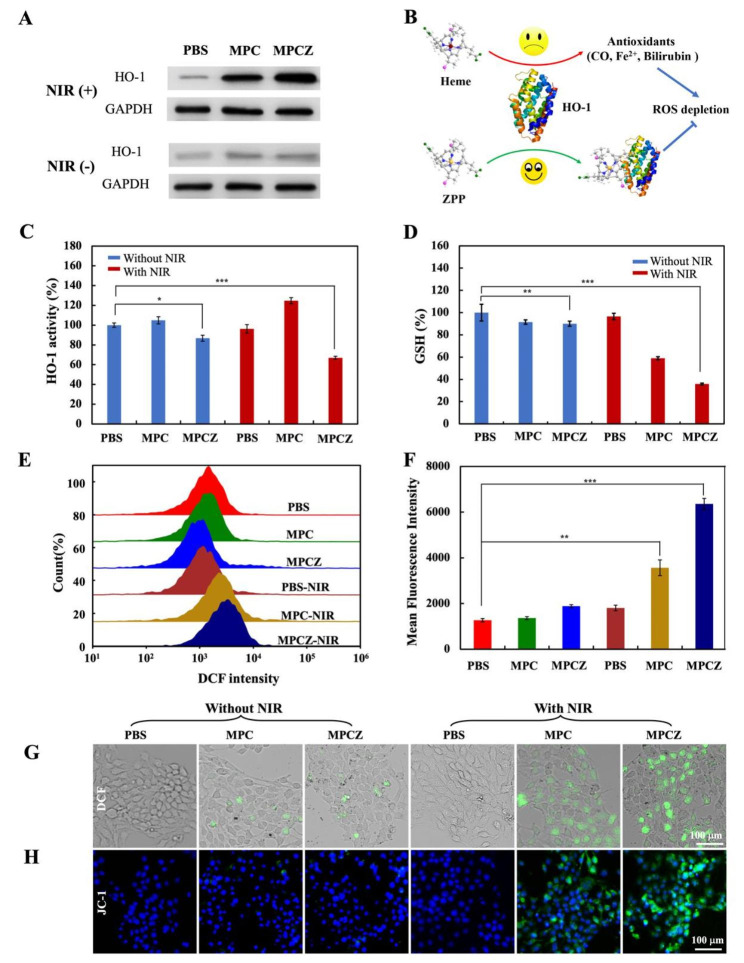
Fig. 5.
Intracellular oxidative stress responses. (A) The western blotting analysis of HO-1 expression in PBS, MPC and MPCZ groups with or without 808 nm laser irradiation. (B) Schematic illustration of ZPP interacting with HO-1 by competitively with heme to inhibit the antioxidant activity of tumor cells. (C) HO-1 activity by bilirubin assay. (D) Intracellular GSH levels. (E) and (F) Flow cytometry analysis of ROS in 4T1 cells treated with different nanoparticles. (G) DCF fluorescence imaging of MPCZ NPs in 4T1 cells induced by ROS. (H) Fluorescence images of 4T1 cells stained with JC-1 (green) were used to analyze the depolarization of mitochondrial membrane. For (A) and (C) to (H), 4T1 cells were treated with MPC and MPCZ NPs (comparable to 25 µg/mL MPC or 1.25 µg/mL ZPP) for 6 h, then irradiated with or without 808 nm laser (1 W/cm2) for 10 min and incubated for following 6 h. For (C), (D) and (F), the asterisks represent statistical significance in comparison to the PBS group based on one-way ANOVA with Tukey post-hoc analysis. *p < 0.05, ** p < 0.01, ***p < 0.001

