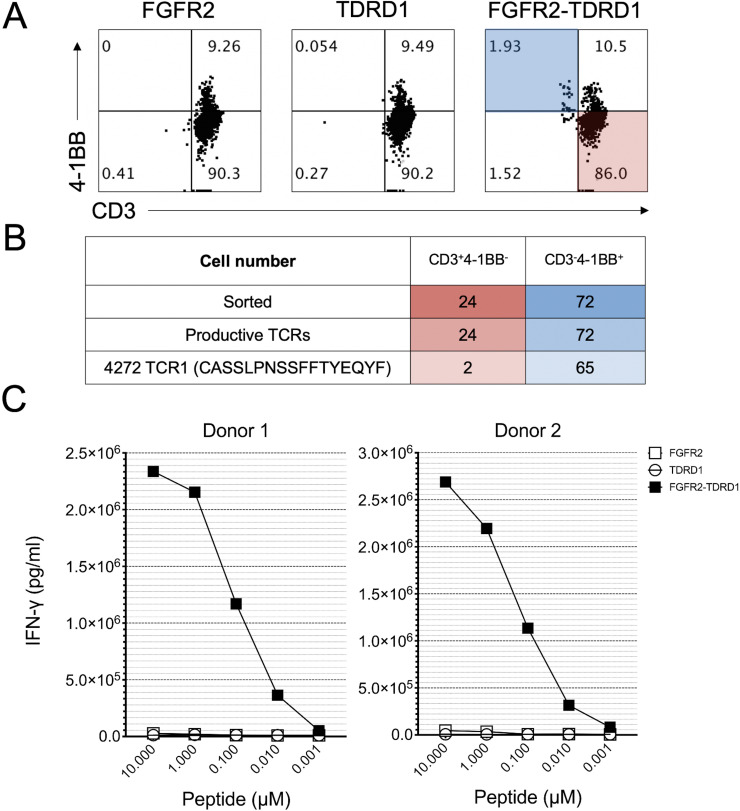
Figure 3.
TCR derived from TIL3 cells specifically recognized FGFR2-TDRD1 fusion peptide. (A) TIL3 cells from patient 1 were co-cultured with autologous DCs that were pulsed with FGFR2-TDRD1 or FGFR2 and TDRD1 wild type peptides. Dot plots depict the flow cytometric analysis that was performed the following day. Data was gated on live CD4+ T cells. Cells in the shaded areas (CD3−4-1BB+ in blue and CD3+4-1BB− in red) were subjected to single-cell sorting and TCR sequencing. (B) Results of single-cell TCR sequencing. The table indicates the number of cells that were sorted from CD3−4-1BB+ and CD3+4-1BB− fractions (top row), along with the number of cells that exhibited any productive CDR3b sequence (middle row) or a CDR3b sequence corresponding to the TCR1 (bottom row). (C) PBMCs from two healthy donors were transduced with TCR1 and co-cultured with patient 1’s B cells that were pulsed with decreasing concentrations of FGFR2-TDRD1, or control FGFR2 and TDRD1 peptides. The following day, IFN-γ production was measured using IFN-γ electrochemiluminescence assay. Data represents average reads from duplicate co-culture wells; error bars represent SD. Calculated half maximal effective concentrations (EC50s) for IFN-γ production were 0.089 µM for Donor 1 and 0.189 µM for Donor 2. A representative of two independent experiments is shown; all experiments showed comparable EC50 values. DCs, dendritic cells; FGFR2, fibroblast growth factor receptor 2; IFN-γ, interferon gamma; PBMCs, peripheral blood mononuclear cells; TCRs, T-cell receptors; TDRD1, tudor domain-containing 1; TIL, tumor infiltrating lymphocyte.

