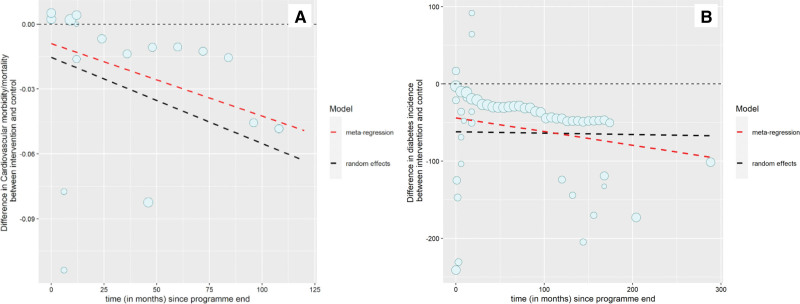
Figure 1.
Difference in disease incidence. A, Cardiovascular disease incidence (cases per 1000 per month) between intervention and comparator arms by time since program end. B, Type 2 diabetes incidence (cases per 1000 per month) between intervention and comparator arms by time since program end. Dot size is proportional to the number of participants in each study. Lines represent estimates of average trend from random effects and meta-regression.

