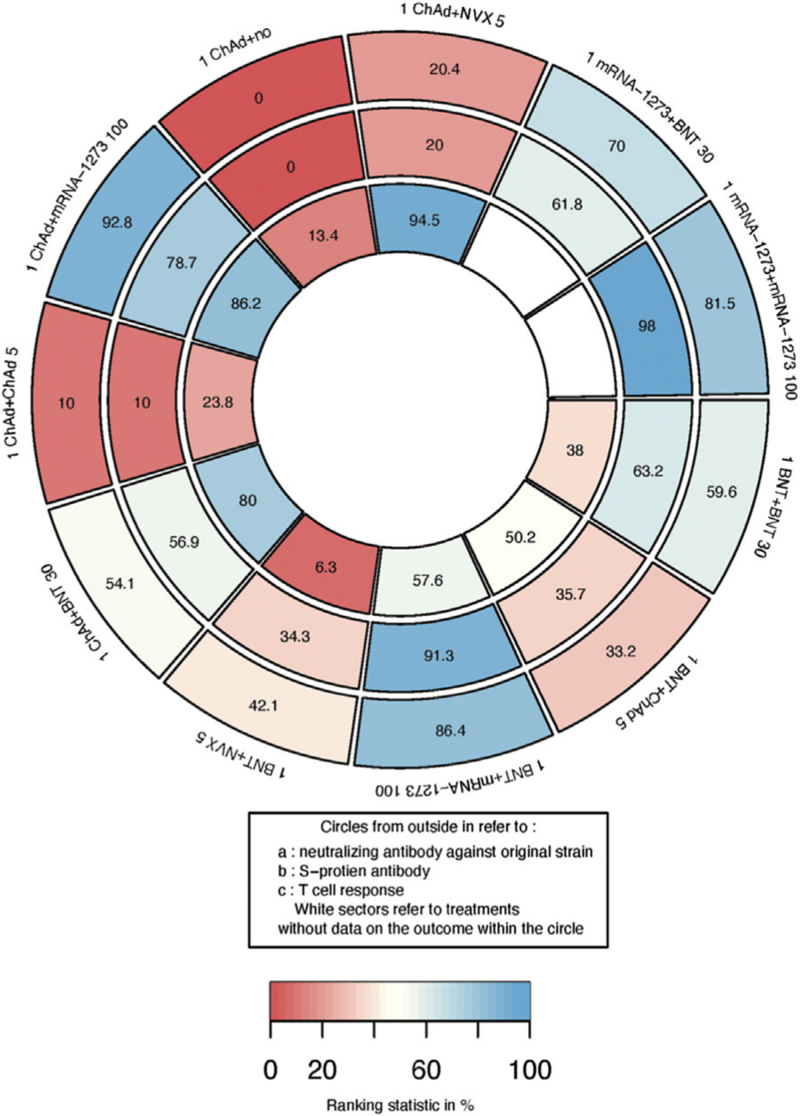
Figure 4.
Ranking heat plot of schedules initiated with mRNA or non-replicating viral vector for immunogenicity outcomes: a larger figure in a given sector means a higher probability of a greater immune response in that sector. Each sector is colored according to the SUCRA value of the corresponding treatment and outcome from red (0%) to blue (100%). 1 ChAd + NVX 5: one dose of ChAdOx1 followed by NVX-CoV2373 5 μg; 1 mRNA-1273 + BNT 30: one dose of mRNA-1273 followed by BNT162b2 30 μg; 1 mRNA-1273 + mRNA-1273 100: one dose of mRNA-1273 followed by mRNA-1273 100 μg; 1 BNT + BNT 30: one dose of BNT162b2 followed by BNT162b1 30 μg; 1 BNT + ChAd 5: one dose of BNT162b2 followed by ChAdOx1 5 × 10¹⁰ viral particles; 1 BNT + mRNA-1273 100: one dose of BNT162b2 followed by mRNA-1273 100 μg; 1 BNT + NVX 5: one dose of BNT162b2 followed by NVX-Cov2373 5 μg; 1 ChAd + BNT 30: one dose of ChAdOx1 followed by BNT162b2 30 μg; 1 ChAd + ChAd 5: one dose of ChAdOx1 followed by ChAdOx1 5 × 10¹⁰ viral particles; 1 ChAd + mRNA-1273 100: one dose of ChAdOx1 followed by mRNA-1273 100 μg; 1 ChAd + no: one dose of ChAdOx1 only. SUCRA: Surface under the cumulative ranking curve.

