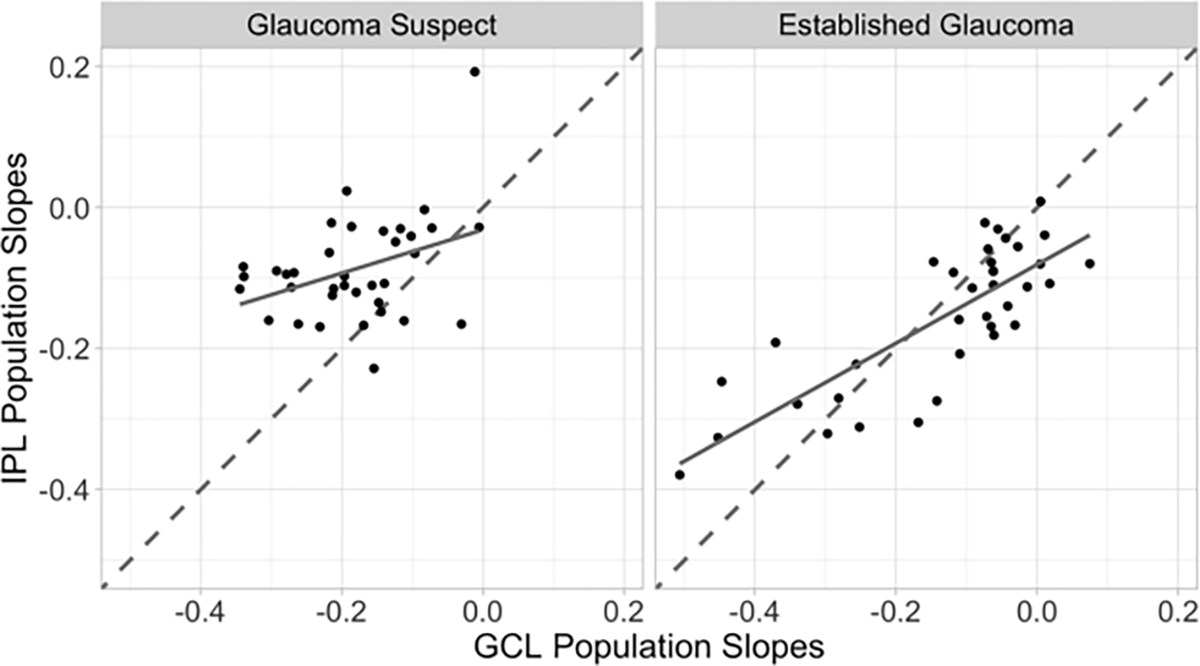
Figure 1.

Posterior mean rates of change for inner plexiform layer (IPL) at each of 36 central macular superpixels plotted against the posterior mean rates of change for ganglion cell layer (GCL) in glaucoma suspect (left) and established glaucoma (right) groups. Dashed line is the line of unity (x=y), the solid line is the least squares regression line for the points in the plot. Points to the left of the dashed line have more negative population GCL slopes than the IPL population slope.
