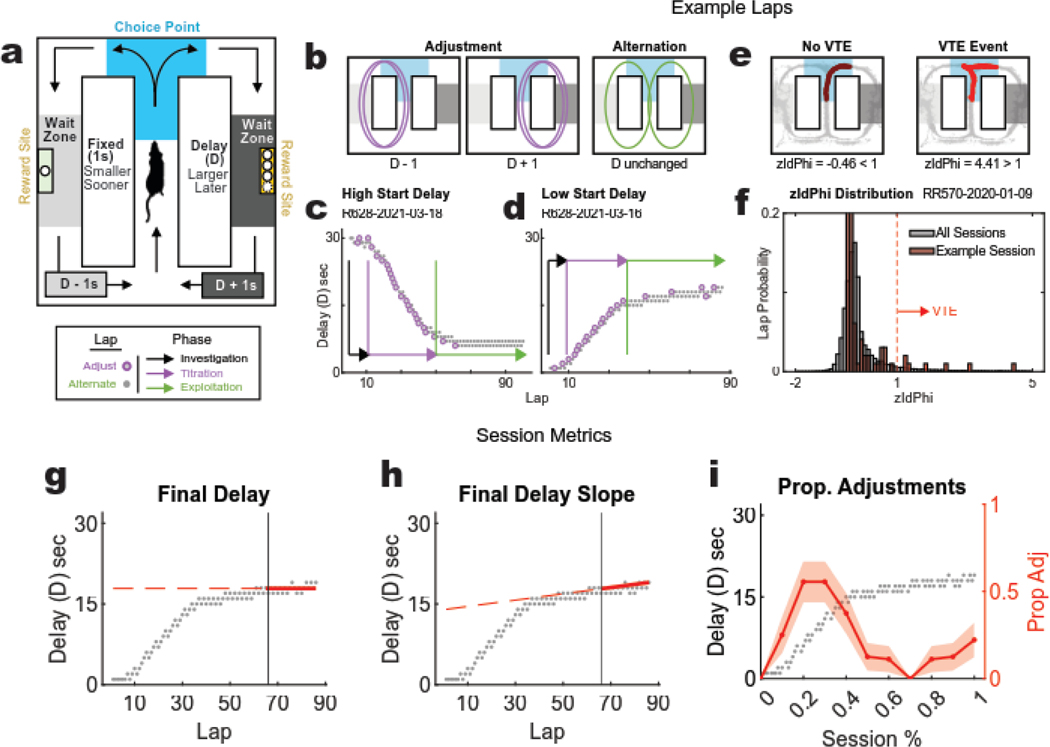
Figure 1: Spatial Delay Discounting task, behavior phases, and metrics.
(a) DD Task Schematic: rats repeatedly faced left/right decisions between a small (1 pellet) reward delivered after a fixed 1s delay, and a large (3 pellets for females, 4 for males) reward dispensed after a variable delay (D). Rats manipulated the variable delay throughout each 45-minute session by increasing it by 1s each time the larger reward was earned and decreasing it by 1s each time the smaller one was earned. The delay was indicated by audible tones that were triggered upon entry into the reward zones (delay tone decreased in 250 Hz increments, the higher the delay tone pitch, the longer the delay). (b) Adjustment vs. Alternation Laps: on each lap, the rat can either adjust the delay down (left) or up (middle) by turning to the same side as the previous lap, or the rat can alternate (right) to maintain the delay. Well-trained rats typically exhibit three distinct behavioral phases. (c, d) Example sessions: the change in delay to the delayed side across laps as the rat first investigates, then titrates the delay down (c) and up (d) until reaching a preferred duration that is held steady through exploitation. (e) Example VTE laps: the rat’s trajectory through the choice point was assessed for each lap. Paths with angular shifts (right) indicate a VTE event, whereas smooth paths (left) do not. (f) Distribution of zIdPhi: zIdPhi was calculated for each trajectory through the choice point. The distribution of these values for all experimental sessions (gray) is shown with that of one example session (red). Laps with zIdPhi >1 were defined as VTE events. (g,h,i) Session-level metrics: (g) The average delay across the final 20 laps of a session (Final delay) measures this preferred delay that the rat is willing to take to balance out the larger reward. (h) The absolute value of the slope of the average final delay, and (i) the proportion of adjustment laps (consecutive laps to the same side) are markers to distinguish titration from exploitation.

