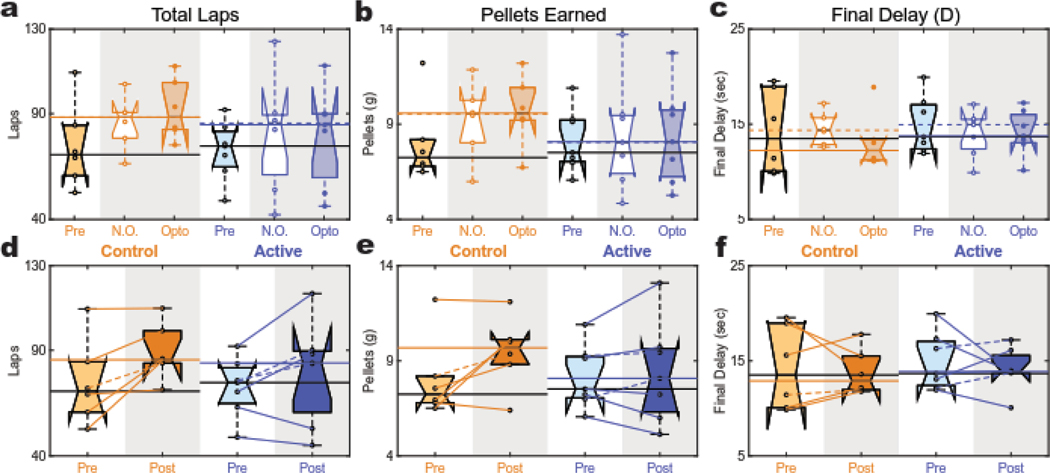
Figure 3: Task Performance and Final Delay.
(a,d) Total Laps: Both cohorts had significant increases in total lap average from (d) baseline to experimental (post) sessions. (a) No difference was detected between opto and no opto sessions in either cohort. (b,e) Total Pellets: No change was detected in total pellet earning in the active animals. However, the control group showed a trend to increase pellet intake from pre to post (e) that was not detected in the active group. (b) No difference was detected between opto and no opto sessions in either cohort. (c,f) Final Delay: Both cohorts showed no change in their average final delay when compared to their baseline (f). (c) No difference was detected between opto and no opto sessions in either cohort. These data suggest the subjective valuation of the larger-later reward (measured by final delay) was stable across time and comparable between groups.

