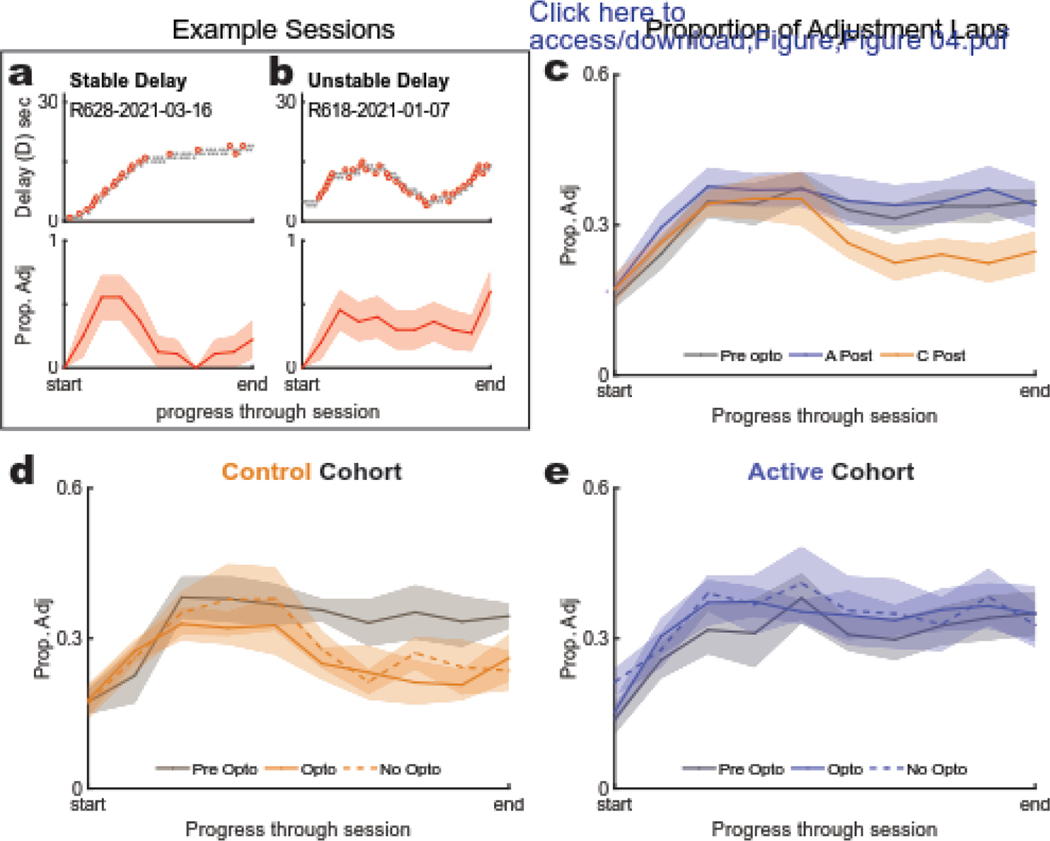
Figure 4: Proportion of Adjustment Laps.
(a,b) Example sessions: the adjustment laps (top) and their running proportion to total laps (bottom) for a typical three phase structure for a session in which the rat maintained a stable delay in the maintenance/exploitation phase (a) and a session in which the rat did not (b). (c) Baseline to experimental (pre-post) comparison: Post stage proportion of adjustment laps for the active group, control group, and their combined baseline data. Each session was normalized on the same start-end scale (from the first to the last lap). (d,e) Effect of opto between cohorts: Proportion of adjustment laps (Prop Adj) during baseline and experimental sessions for control (d) and active (e) cohorts. (d) Control animals showed a significant decrease in proportion of adjustment laps in their late halves of their experimental (post) sessions compared to their baseline sessions. (e) This developing decrease was not seen in the active cohort. No detectable effects were noted between opto and no-opto sessions in either cohort.

