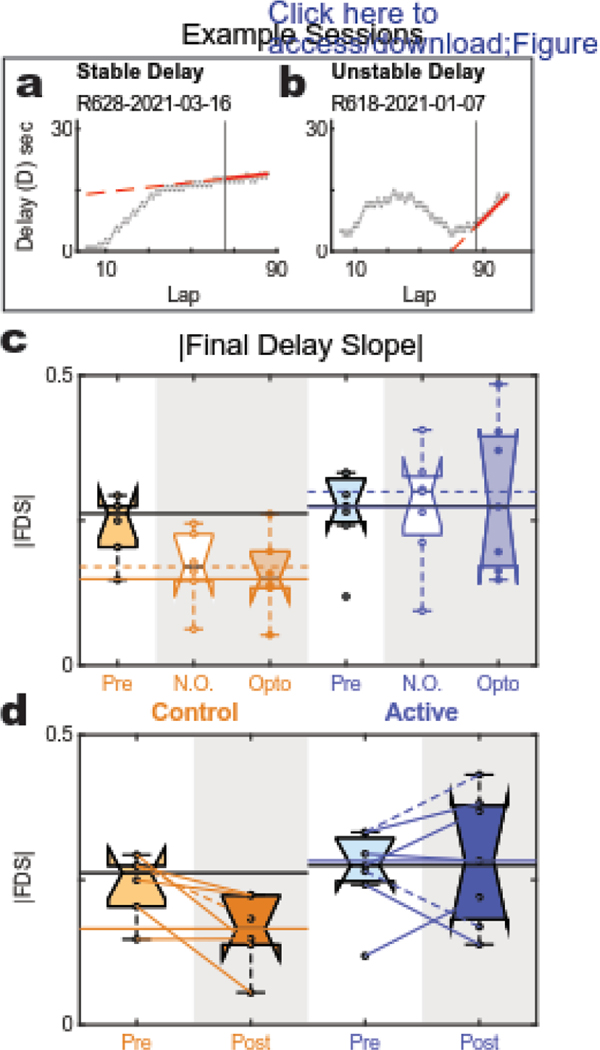
Figure 5: Final Delay Slope.
(a,b) Example sessions: the final delay slope for a typical three phase structure on a session in which the rat maintained a stable delay in the last half of the session (a) and a session in which the rat did not (b). (c) Effect of opto between cohorts: No difference was detected between opto and no opto sessions in either cohort. (d) Overall effect of opto on Final Delay Slope: Control animals showed a significant flattening in their post sessions compared to their baseline sessions. Active-cohort animals showed no change in Final Delay Slope between their baseline (pre) and experimental (post) sessions.

