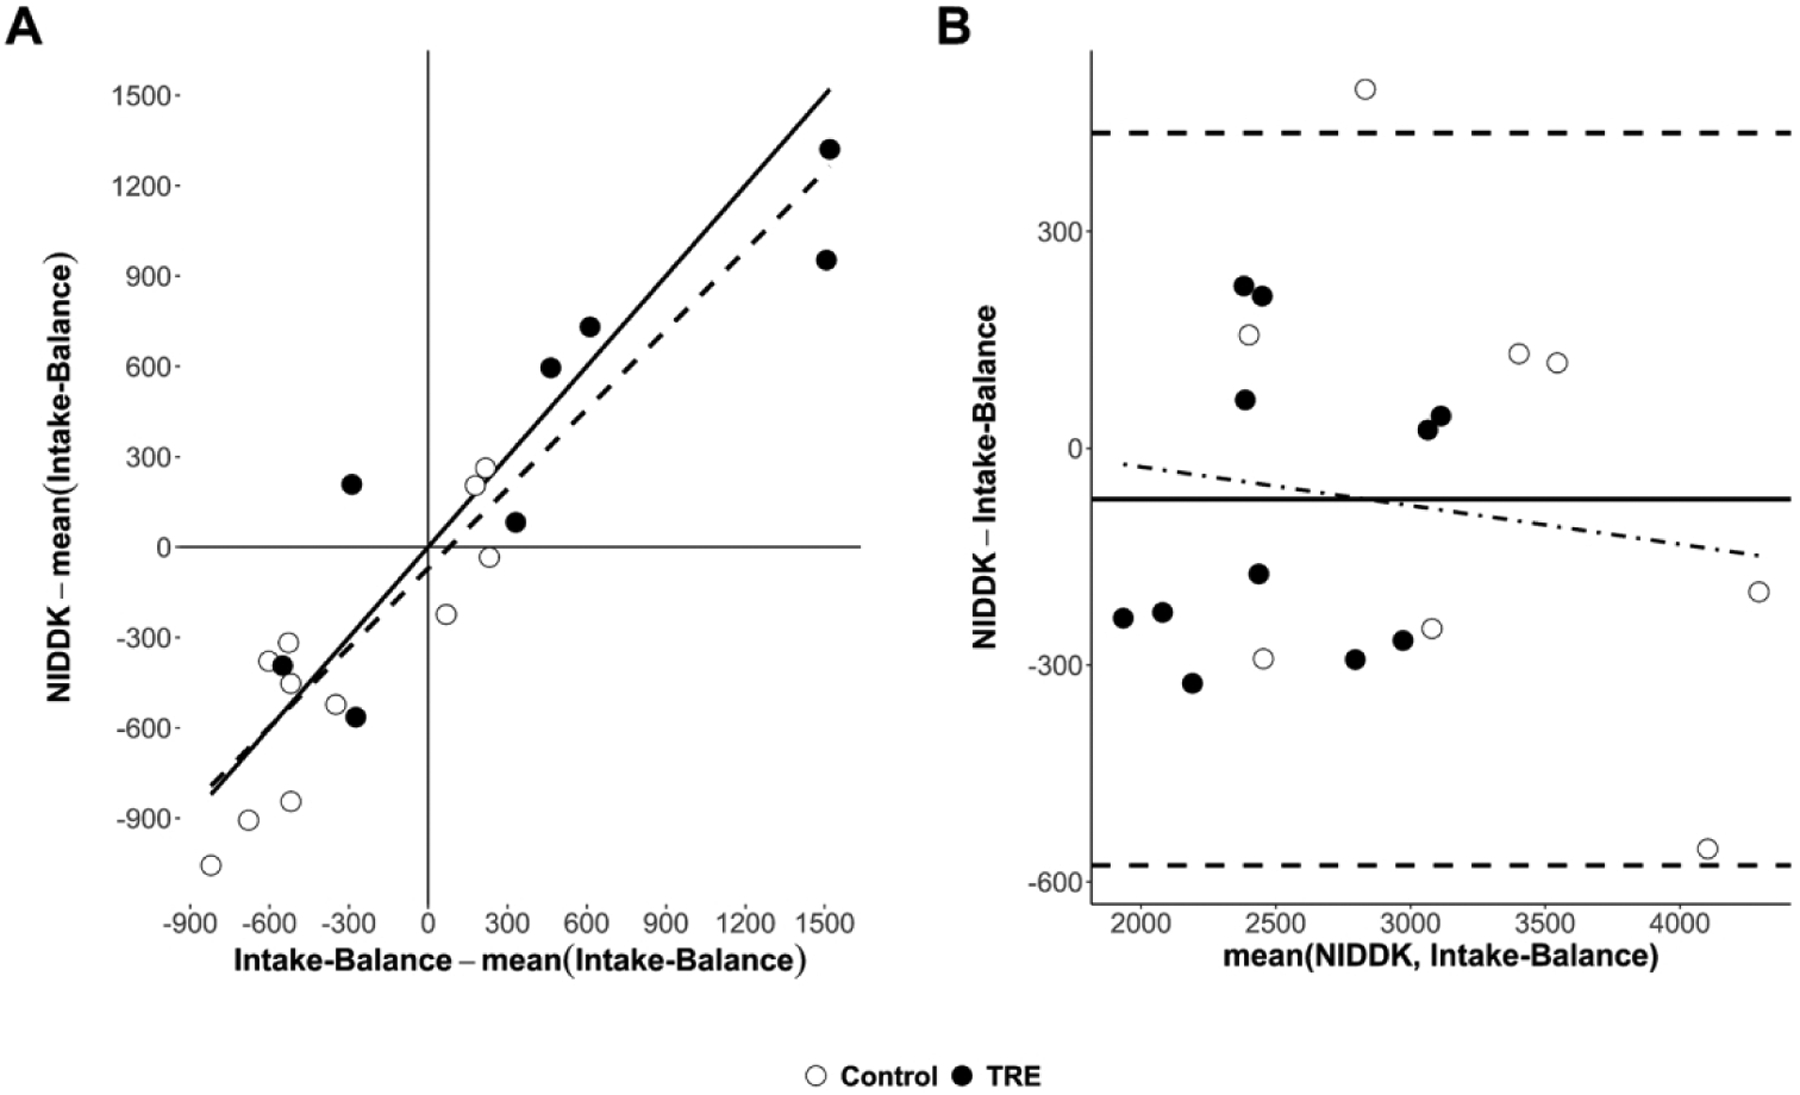
Figure 2.

Comparison of estimated energy intake (kcal/day) between the accelerometer-based intake-balance method and the NIDDK bodyweight planner. Values are from the Post assessment where, unlike the Pre assessment, individuals were not assumed to be weight stable. A) Scatterplot showing line of identity (solid) and line of best fit (dashed, from least-squares regression), where both variables are centered on the mean of the accelerometer-based intake-balance method to ensure a non-extrapolated intercept with a null-hypothesized value of 0; B) Bland-Altman plot showing limits of agreement (horizontal dashed lines), mean bias (solid horizontal line), and systematic bias (dot-dashed trendline from least squares regression) - Note: NIDDK, National Institute of Diabetes and Digestive and Kidney Diseases; TRE, time restricted eating.
