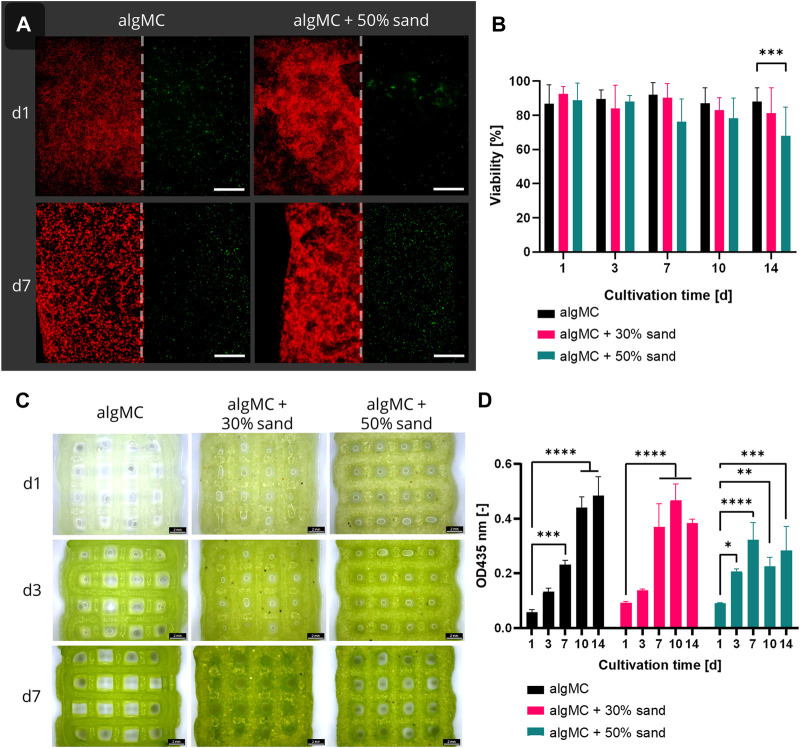
FIGURE 4.
(A) Fluorescence microscope images of immobilized PCC 7002 in the algMC bioink with and without the addition of 50 wt% sand. Living cells show red autofluorescence (left), dead cells appear green (right). Scale bars = 200 µm. (B) Viability of PCC 7002 in the algMC bioink without, with 30 wt% and 50 wt% of sand, respectively, over a cultivation period of 14 days (data shows mean ± SD, n ≥ 5 of two individual experiments, ***p < 0.001). (C) Stereomicroscopic images of algMC scaffolds without with 30, and with 50 wt% sand after 1, 3, and 7 days of cultivation. Scale bar = 2 mm. (D) Measurement of the optical density (OD) at 435 nm (chlorophyll content) over a cultivation period of 14 days (data shows mean ± SD, n = 3, *p < 0.05, **p < 0.01, ***p < 0.001, ****p < 0.0001).

