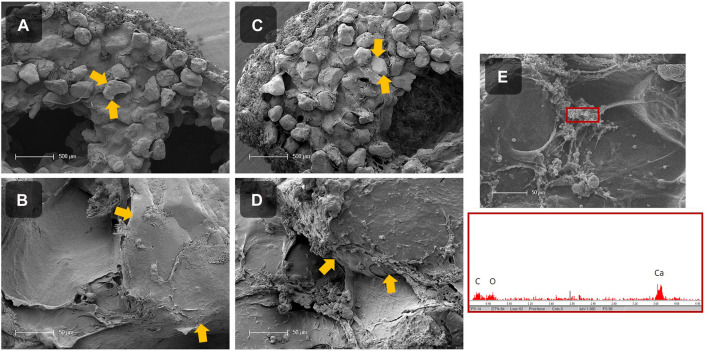
FIGURE 8.
SEM images of the cross section of dried, mineralized scaffolds without cells (= abiotic control; (A, B)) and with PCC 7002 (= LBM; (C–E)) with 50 wt% of sand. Sand particles are marked with yellow arrows. EDX measurement of precipitates inside of the scaffold with PCC 7002, showing a calcium peak (E). Scale bars (A, C) = 500 μm, scale bars (B, D, E) = 50 µm.

