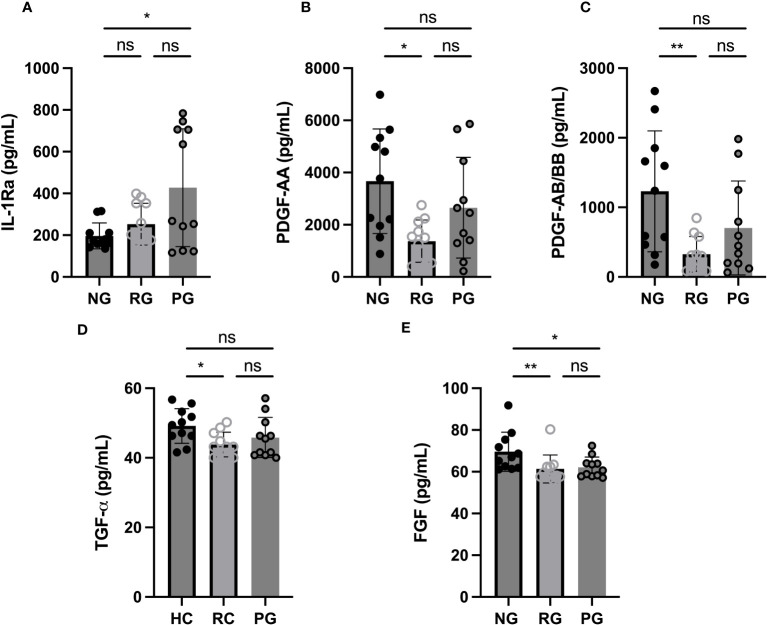
Figure 1.
Plasma cytokine levels among groups. (A) IL-1Ra, (B) PDGF-AA, (C) PDGF-AB/BB, (D) TGF-α, and (E) FGF levels were measured in plasma collected from NG, RG, and PG. The data are represented as the box and scatter plots with each circle representing a single individual. P values were calculated using the Mann–Whitney U-test. *p < 0.05, **p < 0.01, ns, non-significant.

