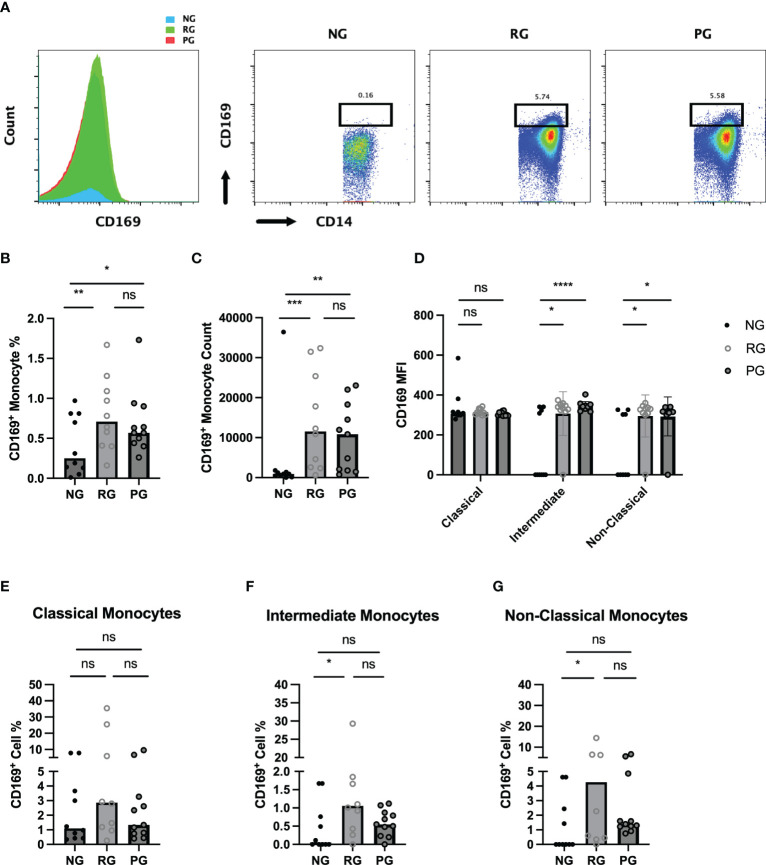
Figure 4.
Characterization of circulating CD169+ monocytes in NG, RG, and PG groups. Representative histogram and dot plot of CD169+/CD14+ monocytes in NG, RG, and PG groups. Percentage of total CD169+ monocytes from total CD14+ monocytes is shown above the gate (B). Total CD169+ monocyte percentage from CD45+ cells, (C) CD169+ monocyte, (D) MFI of CD169 on monocyte subsets in NG, RG, and PG. The percentage of CD169+ cells identified in (E) classical monocytes, (F) intermediate monocytes, and (G) non-classical monocytes within NG, RG, and PG groups. Mann-Whitney-U Test *p < 0.05, **p < 0.01, ***p < 0.001, ****p < 0.0001, ns, non-significant.

