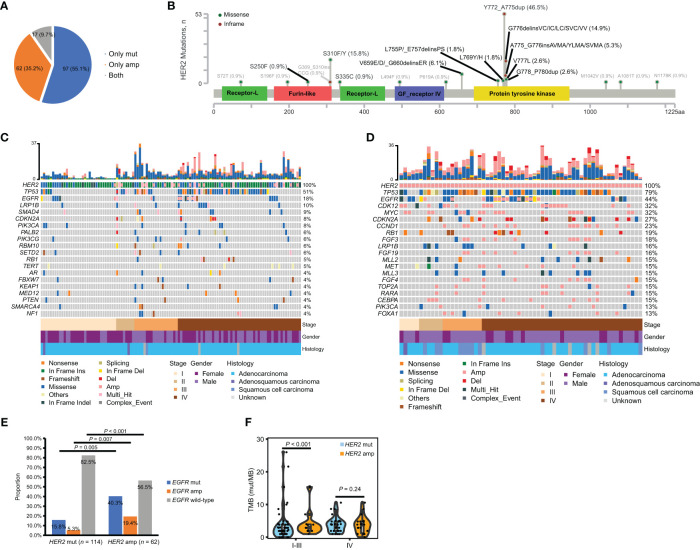
Figure 1.
Incidence and co-mutation profiles among treatment-naïve HER2-altered NSCLC patients from the geneplus dataset. (A) Pie plot showing the incidence of HER2 mutation only (n = 97), HER2 amplification only (n = 62) or both HER2 mutation and amplification (n = 17) within our cohort. (B) Oncogenic (black) and non-oncogenic mutations (gray) in HER2-mutant patients were localized to HER2 protein. (C, D) Heatmap displaying the mutation landscapes of patients with HER2 mutations (n = 114) (C) and with HER2 amplification only (n = 62) (D). Each column represents data from a single patient. The number of somatic mutations of each patient and the mutation frequency of each gene are shown in the top and right respectively. The bottom heatmaps indicate key patient characteristics. (E) The proportion of EGFR mutation, amplification and EGFR wild-type in patients with HER2 mutations (n = 114) and with HER2 amplification only (n = 62). (F) Difference of TMB between patients with HER2 mutations (n = 106) and with HER2 amplification only (n = 60) in early- and late-stage disease respectively. Amp, amplification; mut, mutation; TMB, tumor mutation burden.

