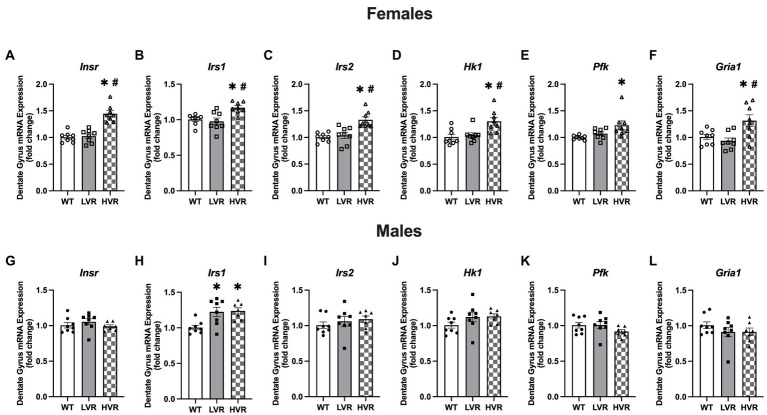
Figure 5.
Female HVR have enhancements in brain insulin signaling and glucose metabolism. (A–F) Transcript expression levels of Insr, Irs1, Irs2, Hk1, Pfk, and Gria1 in female WT (N = 8), LVR (N = 8), and HVR (N = 7). (G–L) Transcript expression levels of Insr, Irs1, Irs2, Hk1, Pfk, and Gria1 in male WT (N = 8), LVR (N = 8), and HVR (N = 7). *Denotes significant Tukey post-hoc difference relative to WT following one-way ANOVA. #Denotes significant Tukey post-hoc difference relative to LVR following one-way ANOVA. Values expressed as mean + SEM.

