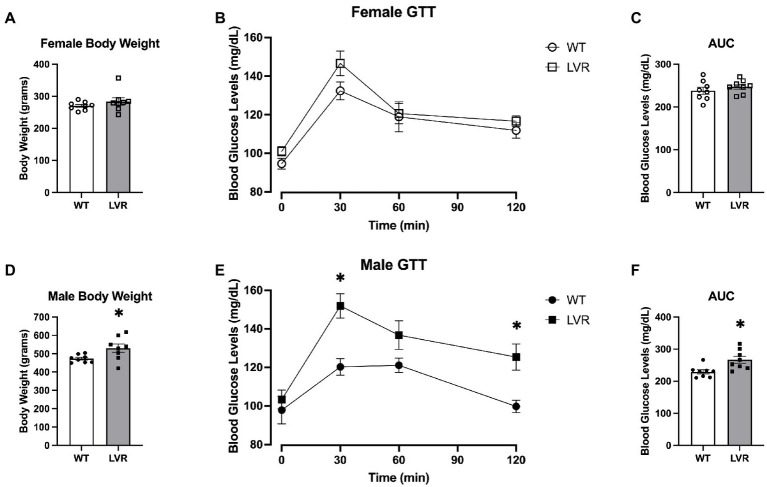
Figure 6.
Male LVR display deficits in glucose uptake and increased bodyweight. (A) Bodyweight of 4-month-old female WT and LVR (N = 8). (B) Glucose tolerance testing results in female WT and LVR. (C) Area under the curve analysis of glucose tolerance testing in females. (D) Bodyweight in male WT and LVR (N = 8) evaluated by Student’s t-test. (E) Glucose tolerance testing results in male WT and LVR evaluated by RM 2-way ANOVA. (F) Area under the curve analysis of glucose tolerance testing in males evaluated by Student’s t-test. *Denotes significant difference between groups. Values expressed as mean + SEM.

