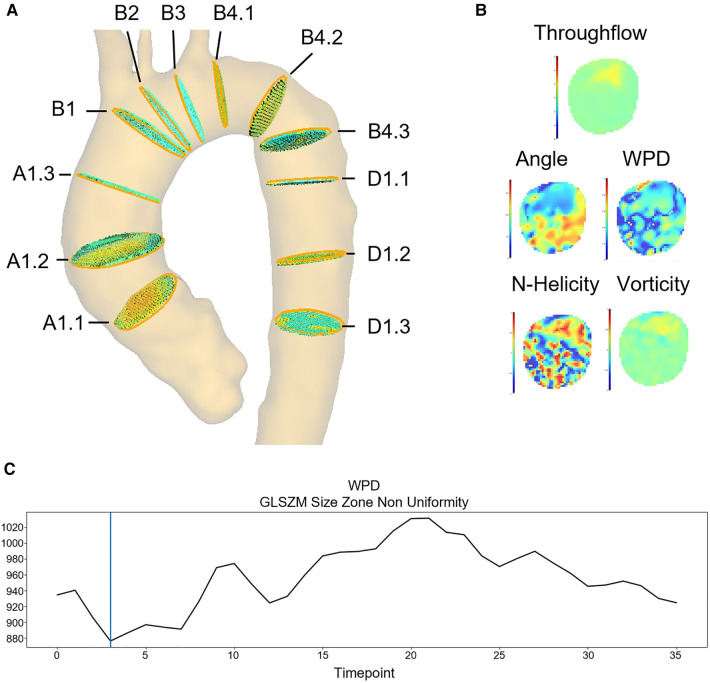
Figure 2.
Feature extraction example: (A) 12 standardized image planes covering the ascending aorta, the aortic arch and the descending aorta. (B) Flow parameter maps calculated for each segmented image plane and timeframe (here plane A1.1): throughflow, angle, WPD, LNH and vorticity. (C) Feature curve showing the GLSZM Non-Uniformity based on the WPD map throughout the cardiac cycle on plane A1.1.

