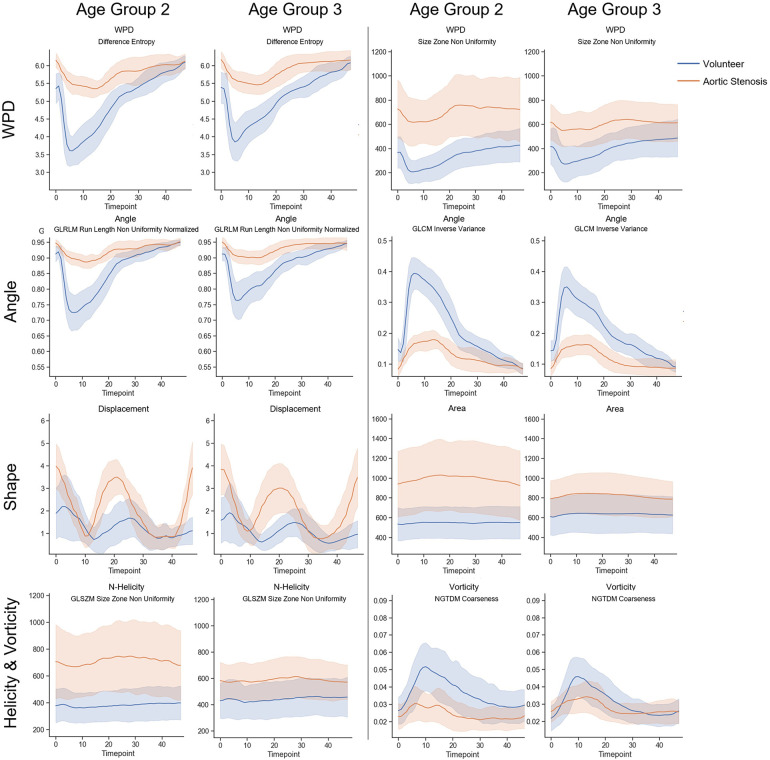
Figure 4.
Comparison of radiomics feature value ranges for patients with aortic valve stenosis (cohort2: orange) and age-matched subjects from the population without valve diseases (cohort3: blue). The curves in row 1 show radiomics parameters extracted on WPD parameter maps over the complete cardiac cycle in age group 2 (40–59), and and in age group 3 (60–80). Together with with the parameters shown in row two, which were extracted from flow angle maps, these selected features describe patterns related to the flow direction. The parameters in row three describe the shape and motion, while the parameters in row four describe patterns related to normalized helicity and vorticity-related patterns over.

