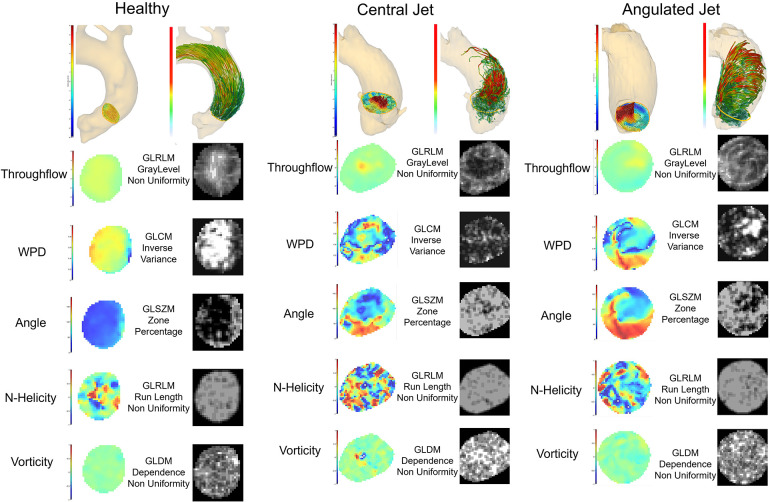
Figure 6.
Radiomics feature analysis of the systolic cross-sectional flow profile in a healthy subject and two patients with different flow patterns caused by aortic valve stenosis. 3D renderings show the flow profile of the analysis plane A1.1 and the corresponding pathline visualization of the flow through this plane. The throughflow, WPD, angle, normalized helicity and vorticity feature maps represent a systolic timepoint. The corresponding radiomics maps were extracted by the pyradiomics library and display the feature, which was most reproducible in the inter-scanner comparison.

