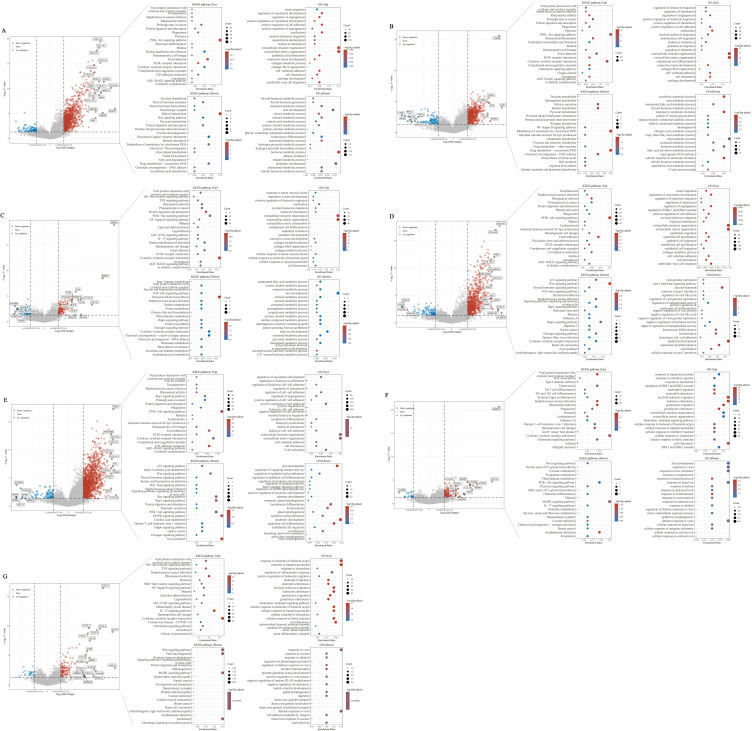
Figure 7.
Construction of a downstream regulatory network for hub genes in EAC. Based on the RNA-seq data of EAC in TCGA database, EAC was divided into high and low expression groups by the mean of COL1A1 (A), TGFBI (B), MMP1 (C), COL4A1 (D), NID2 (E), MMP12 (F), CXCL1 (G) expression levels, and then screened for DEGs between these two groups. The ClusterProfiler package in R software was used to perform GO analysis and KEGG analysis of up- and down-regulated DEGs.

