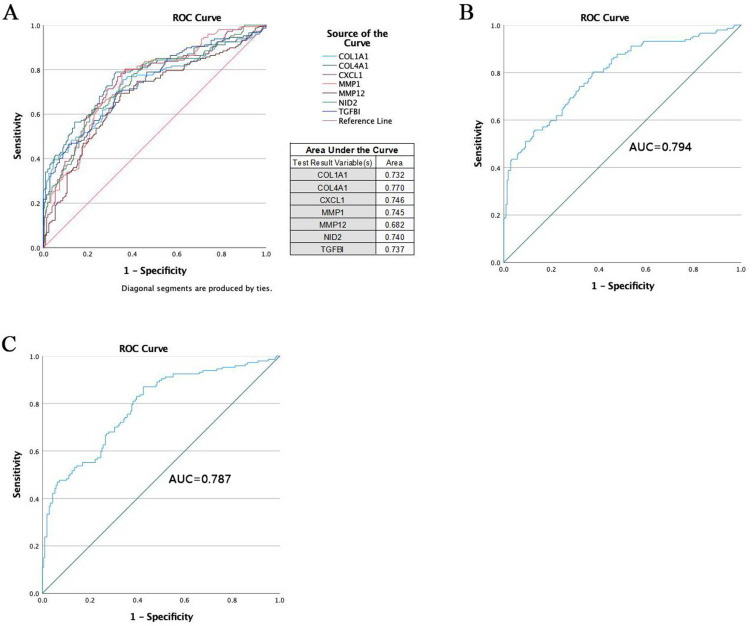
Figure 10.
Construction of disease risk prediction model for NE-BE-EAC based on hub genes. Based on RNA-seq data from 94 NE tissues, 113 BE tissues and 147 EAC tissues in the GEO database, the disease risk prediction based on single hub gene was assessed by ROC curves, and the accuracy of the model was assessed by AUC (A). Similarly, we constructed the risk prediction models of disease progression based on 7 genes (B) and 3 genes (TGFBI, MMP1 and CXCL1) (C). The AUC values are presented separately in the ROC curves.

