Figure 1.

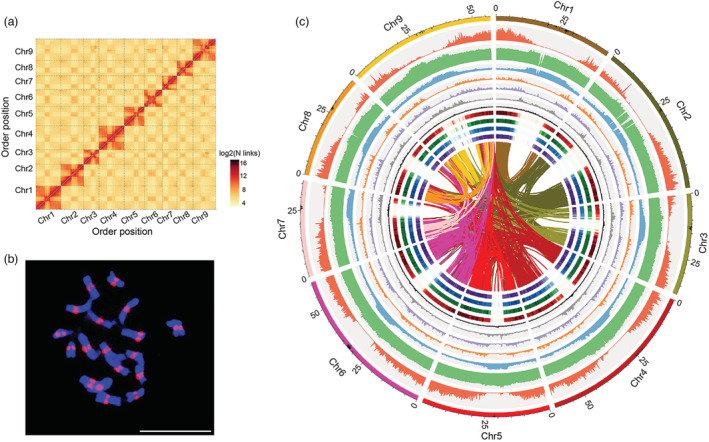
Overview of the radish genome assembly. (a) Genome‐wide Hi‐C map of the NAU‐LB genome. Post‐clustering heatmap shows density of Hi‐C interactions between contigs. (b) Fluorescence in situ hybridization (FISH) assay using NAU‐LB ChIP DNA. FISH signals (red) are visible in the centromeres on the chromosomes (blue). Scale bar: 10 μm. (c) Circos plot of the multidimensional topography for the NAU‐LB genome assembly. The outermost layer of coloured blocks was a circular representation of the 9 pseudochromosomes with each scale mark labelling of 5 Mb. Concentric circles from outermost to innermost show chromosome length with centromere region, gene density, GC content, TE density, LINE density, DNA density, Ty3‐gypsy LTR density, Ty1‐copia LTR density, root gene expression, leaf gene expression, stamen gene expression and pistil gene expression. The inner lines indicate syntenic blocks in the genome.
