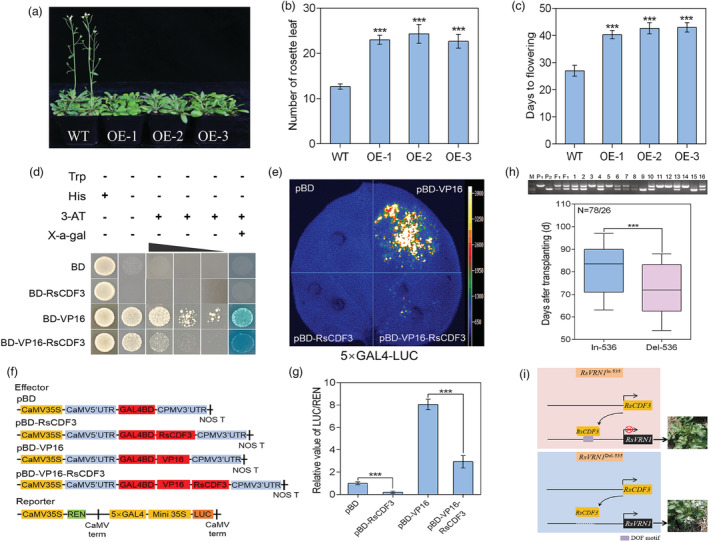
Figure 7.

The overexpression, transcriptional repressor activity of RsCDF3 as well as introgression of the RsVRN1 In‐536 allele in radish. (a) Representative images of wild‐type (WT) and RsCDF3‐OE plants under long‐day (LD) condition. (b, c) Rosette leaf number (b) and days to flowering (c) of WT and RsCDF3‐OE plants under LD condition. (d) Transcriptional repression assay of RsCDF3 in yeast. The transformants were streaked on SD/‐Trp, SD/‐Trp‐His, SD/‐Trp‐His+3‐AT and SD/‐Trp‐His+3‐AT+X‐gal plates. (e) Transcriptional repression assay of RsCDF3 in N. benthamiana leaves. pBD and pBD‐VP16 were used as a negative and positive control, respectively. (f) Schematic diagrams of the effector and reporter constructs used for the transcriptional activity analysis. 5 × GAL4, five GAL4 binding domains; LUC, firefly luciferase; REN, Renilla luciferase. (g) The relative value of LUC/REN measured in the transcriptional activity analysis. (h) Genotyping of proRsVRN1 (up) and boxplot of bolting time (bottom) in the F2 population generated by crossing ‘NAU‐LB’ carrying the RsVRN1 In‐536 allele and ‘NAU‐YH’ carrying the RsVRN1 Del‐536 allele. (i) A proposed model for RsVRN1 In‐536/RsVRN1 Del‐536 allele‐mediated bolting time difference in radish. Values are mean ± SD from three biological replicates. Asterisks indicate statistically significant differences using two‐sided Student's t test (***P < 0.001).
