Figure 4.

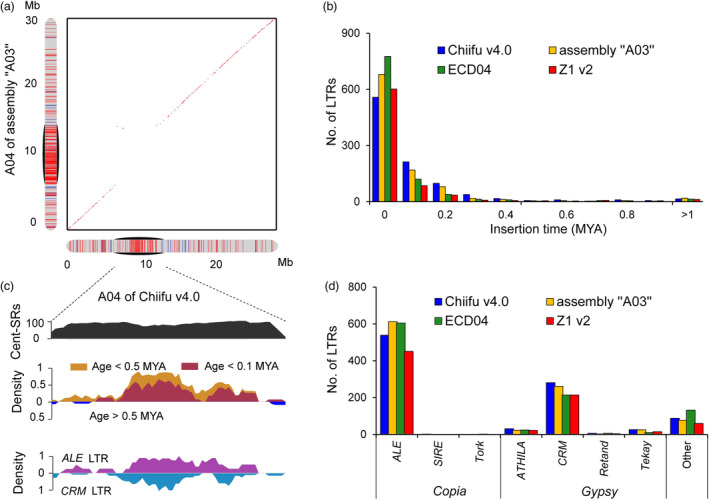
Comparison of centromeres among Brassica rapa genome assemblies. (a) Collinearity of chromosome A04 of Chiifu v4.0 and assembly “A03”. Black ovals indicate centromeres. (b) Insertion time of FL‐LTR‐RTs in centromeres among different assemblies. (c) Distribution of features on the centromere CentA04 in Chiifu v4.0, including Cent‐SRs, LTR age and family. The density was calculated using a 500 kb sliding window and 100 kb step size. (d) Copy number of FL‐LTR‐RT families in centromere regions of B. rapa genome assemblies.
