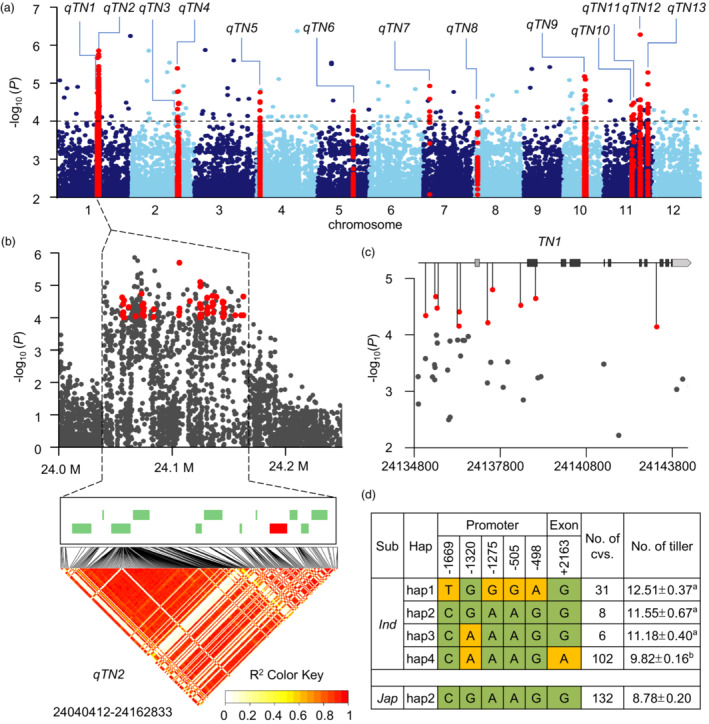
Figure 1.

GWAS of tiller number to identify TN1. (a) Manhattan plot of GWAS results. Red dots represent QTLs. (b) Regional Manhattan plot of qTN2 and pairwise LD analysis. Significant SNPs (−log10(P) ≥ 4) are presented as red dots. Green and red boxes indicate annotated genes, triangles denote QTLs, and dots represent SNPs. (c) TN1‐based association mapping. Red dots indicate SNPs (−log10(P) ≥ 4) in the 2000 bp promoter and 7467 bp genomic sequence. (d) Haplotypes (hap) of TN1 among 279 accessions; major and minor alleles are indicated in yellow and green respectively. Data are presented as mean ± SE. Different letters indicate significant differences at P < 0.05 according to two‐tailed Student's t‐test.
