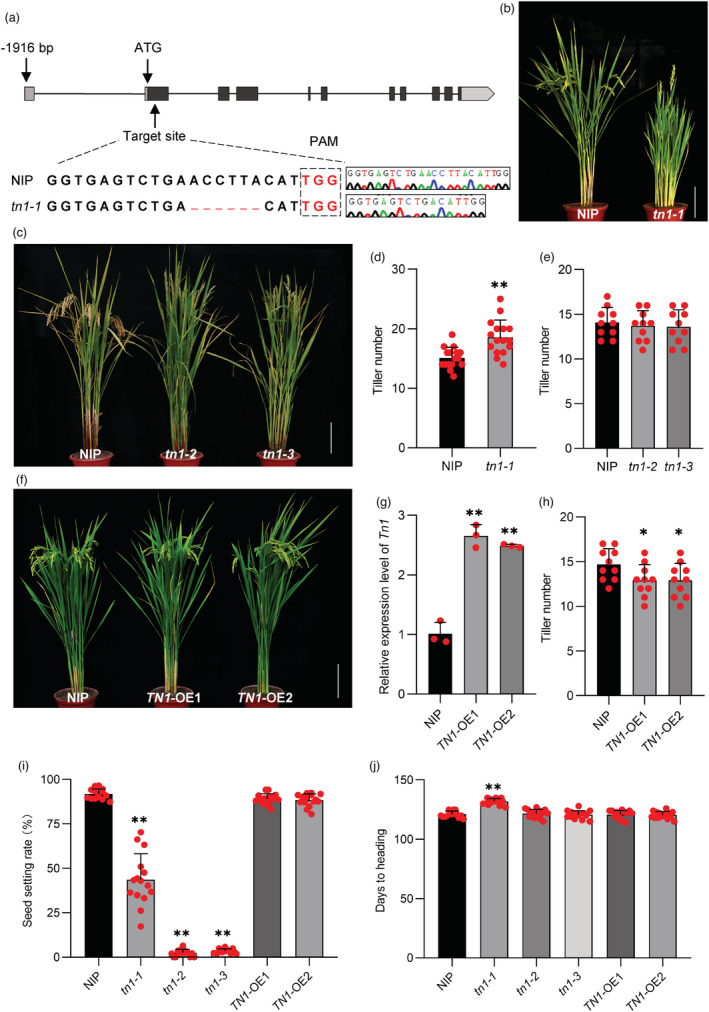
Figure 2.

Phenotypic characterization of TN1‐transgenic plants. (a) Sequences of CRISPR‐knockout lines. (b) Phenotypes of NIP and tn1‐1 lines at the reproductive stage. Scale bar = 20 cm. (c) Phenotypes of NIP and tn1‐2 and tn1‐3 lines at the reproductive stage. Scale bar = 20 cm. (d) Tiller number per plant of NIP and tn1‐1 lines. (e) Tiller number per plant of NIP and tn1‐2 and tn1‐3 lines. (f) Phenotype of NIP and TN1‐OE lines at the reproductive stage. Scale bar = 20 cm. (g) Expression level of TN1 in NIP versus TN1‐OE lines. Data are presented as mean ± SD. (n = 3 biologically independent samples). (h) Tiller number per plant of NIP and TN1‐OE lines. (i) Seed setting rate of NIP, tn1‐1, tn1‐2, tn1‐3, and TN1‐OE lines. (j) Heading date of NIP, tn1‐1, tn1‐2, tn1‐3, and TN1‐OE lines. In (d–j), P‐values were determined using two‐tailed Student's t‐tests. **P < 0.01. Data are presented as mean ± SD (n = 15).
