
Figure 3.
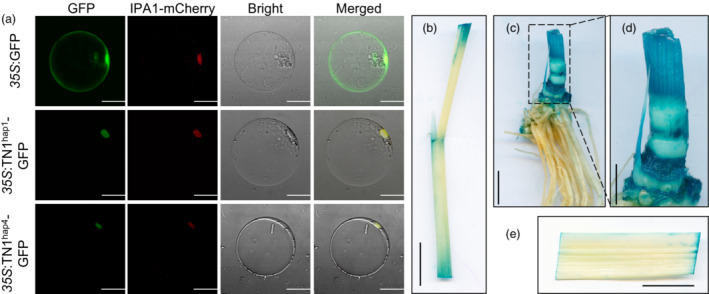
Expression pattern of TN1. (a) Subcellular localization of TN1‐GFP fusion protein in rice protoplasts of different haplotypes. Scale bar = 20 μm. (b, c, e) GUS staining of tissues (leaf sheath, tiller, and leaf respectively) in ProTN1:GUS‐transgenic plants at 30 days after transplanting. Scale bar = 2 cm. (d) Enlarged version of dashed box in (c). Scale bar = 1 cm.