Figure 4.

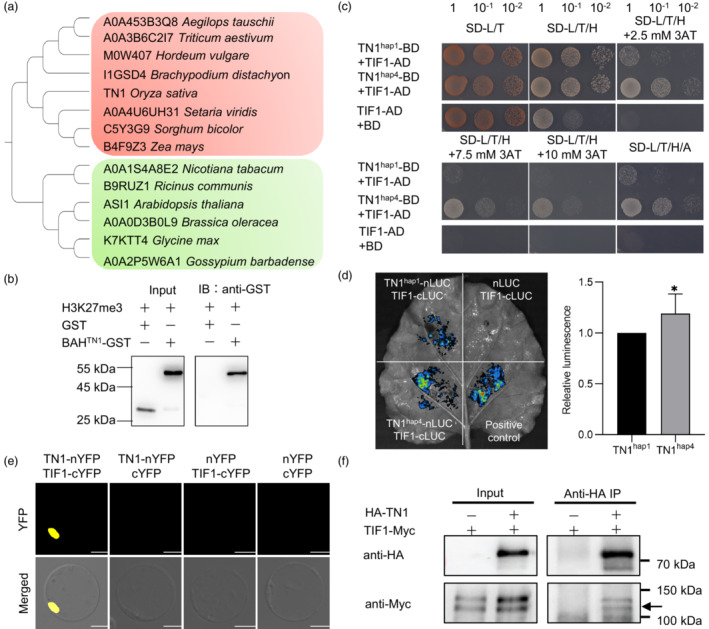
TN1 interacts with TIF1. (a) Phylogenetic analysis of the TN1 protein in 14 species. Monocots and dicots are indicated in orange and green respectively. (b) TN1 recognizes the H3K27me3 peptide in pull‐down assay. (c) Yeast two‐hybrid assay showing interactions of different genotypes of TN1 with TIF1. (d) Luciferase complementation image (LCI) assay in Nicotiana Benthamian leaves. The fluorescence intensity of TN1hap1 and TIF1 was set as 1, and the assay was repeated eight times. (e) Bimolecular fluorescence complementation (BiFC) assay in rice protoplasts. Scale bar = 10 μm. (f) TN1 directly interacts with TIF1 in Co‐IP assay. Black arrow indicates TIF1‐Myc.
