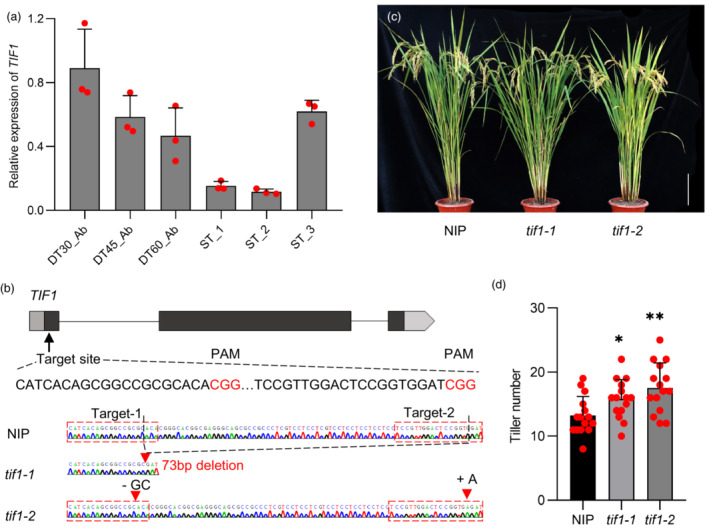
Figure 5.

TIF1 negatively regulates tiller number in rice. (a) Expression levels of TN1 in tillering tissues. Data are presented as mean ± SD (n = 3 independent biological samples). DT30_Ab, DT45_Ab, DT60_Ab, ST_1, ST_2, and ST_3 represent developmental stages described in Materials and Methods. (b) Mutation targets of tif1‐1 and tif1‐2. (c) Phenotypes of NIP and tif1‐CRISPR lines at the reproductive stage. Scale bar = 20 cm. (d) Tiller number per plant of NIP and tif1‐CRISPR lines. P‐values were determined using two‐tailed Student's t‐tests. **P < 0.01. Data are presented as mean ± SD (n = 15).
