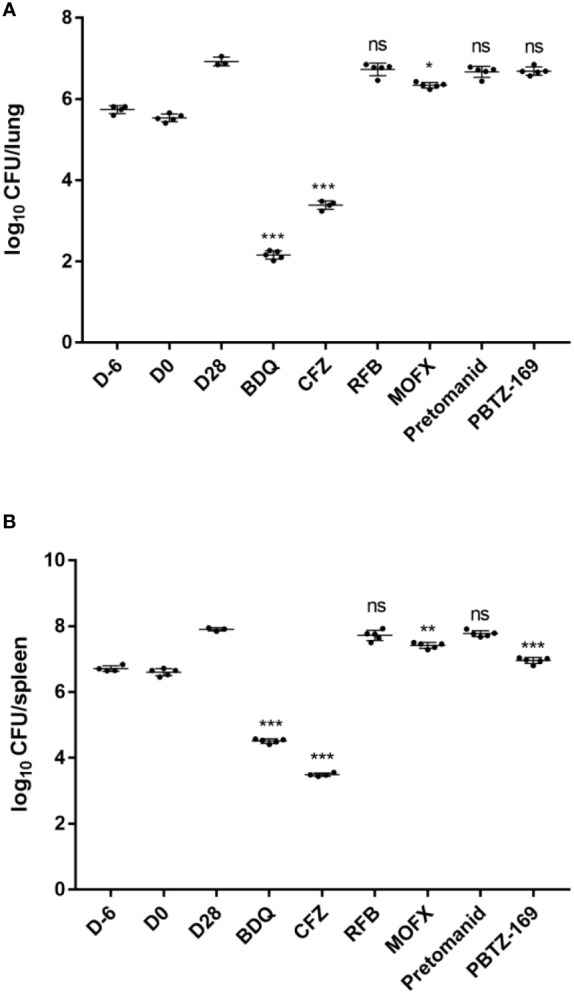
Figure 2.

Mean number (log10) of CFU per lung (A) and spleen (B) in various groups of mice infected with M. avium. Two mice failed to infect due to operational reasons, bacteria did not enter the tail vein, showing thickened tail redness and swelling, and mice weighed significantly higher than other members of this group (one each from CMC and CFZ group). One mouse from CMC group died during the treatment period. D-6 represents the day after infection, D0 represents the start of drug treatment in mice, and D28 represents twenty-eight days after drug treatment in mice. *P <0.05; **P <0.01; ***P <0.001; “ns” indicates no statistically significant difference between the two groups.
