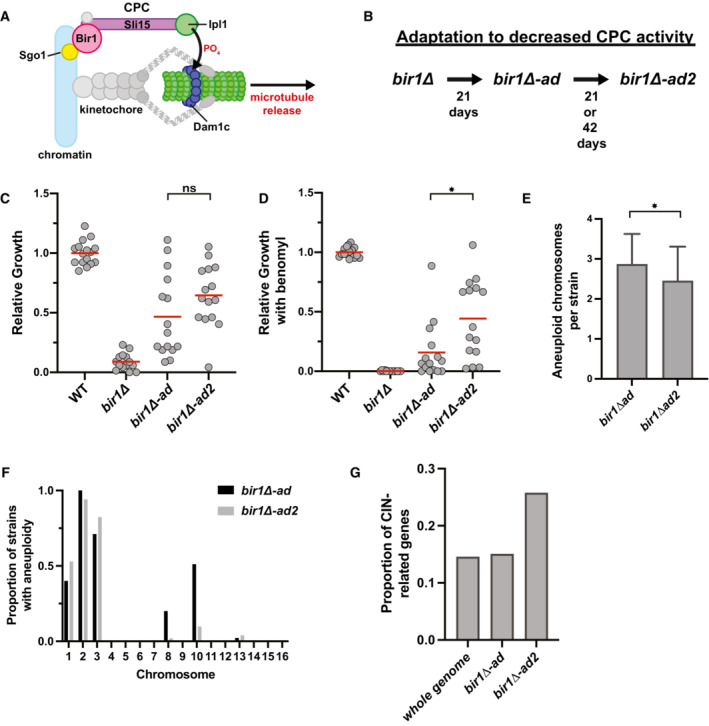
Figure 1. Strains with high levels of CIN and aneuploidy adapt by decreasing CIN.

-
ASchematic summarizing the main localization of the CPC and its role in phosphorylating the Dam1 complex (Dam1c) to destabilize microtubule attachments.
-
BSummary of the adaptation time‐line. bir1∆ strains from tetrads were grown clonally for 21 days to produce bir1∆‐ad strains. Colonies from the bir1∆‐ad strains were then grown in liquid media for 21 or 42 additional days to produce the bir1∆‐ad2 strains.
-
C, DGrowth comparisons of wild‐type (WT, n = 16), unadapted (bir1∆, n = 14), partially adapted (bir1∆‐ad, n = 15), and further adapted (bir1∆‐ad2, n = 15) strains as measured by area of growth after serial dilution. The serial dilutions of all these strains were carried out once in parallel. Examples of dilutions series such as those used in the quantification for bir1∆‐ad and bir1∆‐ad2 strains can be found in Fig EV1C. Ten‐fold serial dilutions were made on YPAD plates containing either 0.1% DMSO (C) or 10 μg/ml of benomyl (D). The mean (red line) is shown. Growth was normalized to WT.
-
EComparison of the mean number of aneuploid chromosomes per strain for the bir1∆‐ad (n = 45 strains) and bir1∆‐ad2 (n = 51 strains) collections. Only data from bir1∆‐ad strains that were subjected to additional adaptation are shown. Means and standard deviations are shown.
-
FHistogram showing the proportion of strains that are aneuploid for specific chromosomes in partially adapted (bir1∆‐ad) and further adapted (bir1∆‐ad2) strains.
-
GEight hundred and seventy‐four genes out of 6,002 total yeast genes (14.5%) have phenotypes related to CIN. The percentage of newly identified mutations in the bir1∆‐ad2 (26 out of 98) and bir1∆‐ad (37 out of 246) strains that are related to CIN are shown.
Data information: (ns) not significant; (*) P < 0.05; unpaired t‐test.
