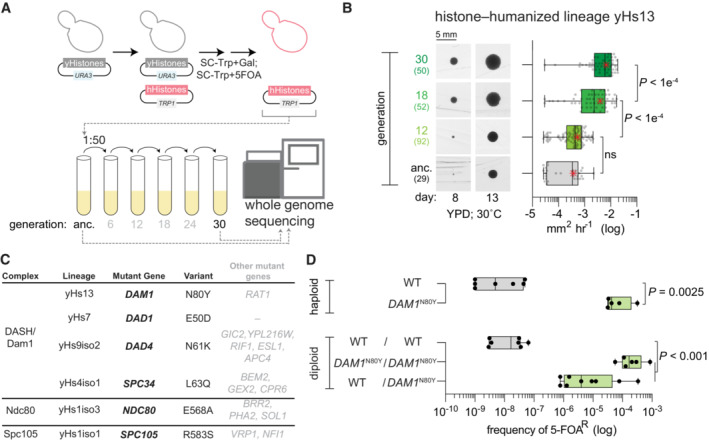
Figure 1. DASH/Dam1c mutants are dominant genetic suppressors of histone humanization.

- Dual‐plasmid histone shuffle strategy used to generate histone‐humanized yeasts (see Materials and Methods for details). Humanized isolates were passaged in a rich medium for at least 5 cycles, at which point the ancestral isolate and evolved were sequenced.
- Growth assay of ancestral and evolved histone‐humanized lineage yHs13. Cells from the ancestral populations and evolved populations (indicated by generations in rich medium) were restruck onto a rich medium agar plate and colonies were imaged for up to 3 weeks to observe the change in colony size (left images). The average growth rate in mm2 h−1 was calculated by taking the change in colony size between time points divided by the time interval (right graph). Numbers in parentheses indicate the number of colonies analyzed, the central band represents the median, the box extends from the 25th to 75th percentiles, the whiskers represent minimum to maximum, and the asterisks represent the mean. The significance of mean differences in growth rates was determined with an ordinary one‐way ANOVA multiple comparisons with Turkey correction of multiple hypothesis tests. Scale bar 5 mm.
- Table of histone‐humanized lineages that evolved a mutation in an outer kinetochore complex. The variant column shows the observed nonsynonymous alteration of the bolded gene in the mutant gene column. Other genes that were mutated in each lineage are shown in non‐bolded font, details of these mutations can be found in Table EV1 and Appendix Table S1.
- Sufficiency validation for the DAM1 N80Y mutation demonstrates the DAM1 N80Y mutation significantly increases the rate of humanization over the wild type (P value = 0.0093). Green‐filled bars indicate successful isolation and confirmation of humanized yeasts. Each point represents a single biological replicate, the central band represents the median, the box extends from the 25th to 75th percentiles and the whiskers represent the minimum and maximum. The significance of the mean difference in 5–FOAR frequency was determined with the Mann–Whitney test.
