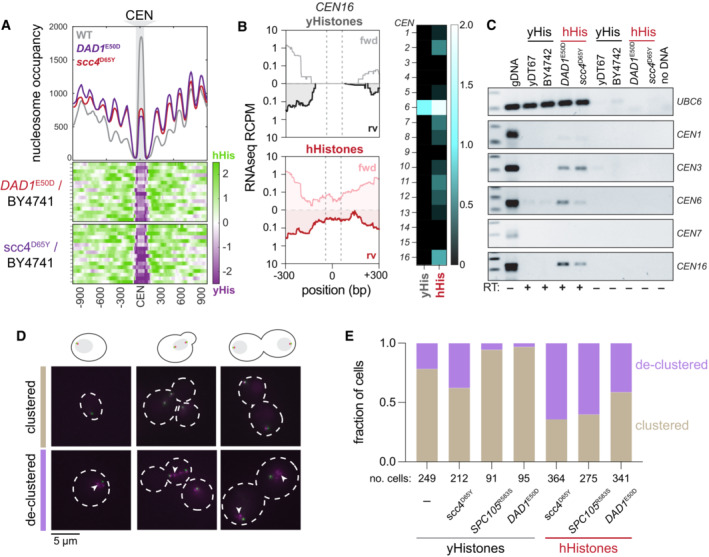
Figure 3. Histone humanization cause centromere dysfunction in yeast.

- Centromeric nucleosome occupancy. The relative nucleosome occupancy plots are given for each strain in the top plot (gray, wild type; red, DAD1 E50D humanized; purple, scc4 D65Y humanized). Values represent the chromosome mean occupancy 900 bp up and downstream of all 16 centromeres (each centromere occupancy values being an average of three biological replicates). Bottom plots, log2 ratio nucleosome occupancy enriched in humanized (green) and depleted in humanized (purple), each row represents 1 of the 16 centromeric regions.
- Total RNA sequencing of cenRNAs in yeasts. Left; read counts per million tracks for CEN16 in wild type (black, top) and DAD1 E50D humanized (red, bottom) yeasts. Right; heatmap of cenRNAs transcripts per million counts across all chromosomes in wildtype and DAD1 E50D humanized strains. Centromere VI is marked with an asterisk to indicate that the plasmid encoding the histone plasmid also encodes a CEN6 sequence, which reads likely emanant from (See Appendix Fig S3).
- RT‐PCRs of the indicated RNAs. Lane 1 is genomic DNA, lane 2 is wildtype shuffle strain (yDT67), lane 3 is BY4742, lane 4 is DAD1 E50D humanized, lane 5 is scc4 D65Y humanized, lanes 6–9 are the same as 2–5, but without reverse transcriptase added, lane 10 is no DNA.
- Example images from strains with fluorescent tags on the microtubule organizing center (Spc110‐GFP) and the kinetochore (Nuf2‐RFP). Images were taken from cultures in mid‐log phase of growth.
- Bar plots of the fraction of cells with clustered or declustered Nuf2‐RFP foci. Brown shading indicates a fraction of cells with correct clustering, and the purple shading indicates a fraction of cells with declustered Nuf2‐RFP foci. The number of cells analyzed for each genotype is shown below.
