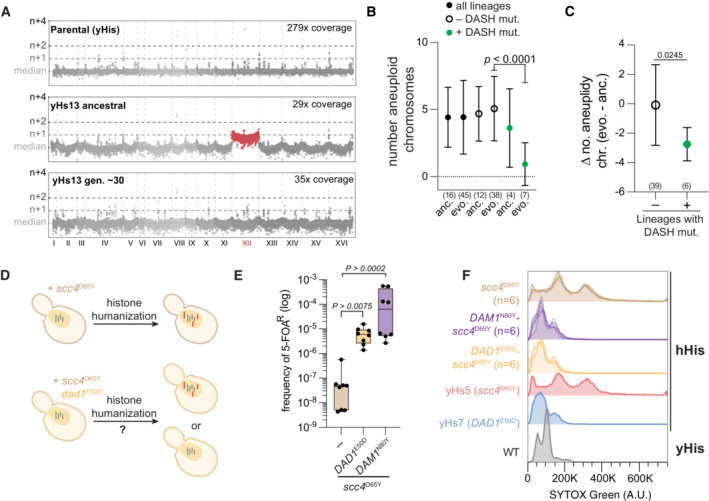
Genome‐wide chromosome coverage maps for the parental (yeast histones) and the ancestral and evolved yHs13 strains (note the loss of aneuploid chromosome XII in the evolved isolate). Note that yHs13 is the lineage that evolved the mutation DAM1
N80Y. Chromosome coverage copy was normalized as the log2 ratio of the average coverage of a 1 Kb window by the genome median coverage.
Evolution of aneuploid chromosomes in histone‐humanized strains. The number of aneuploid chromosomes is given for each of the indicated grouping of humanized strains. The sample size is given below each (number of histone‐humanized lineages), Dunnett's tests of the mean differences between the three ancestral‐evolved pairs are provided. Error bars report the standard deviation.
Change in the average number of aneuploid chromosomes in humanized lineages with or without DASH/Dam1c mutations. The sample size is given below each, unpaired t‐test of the mean difference is provided. Error bars report the standard deviation.
Aneuploidy accumulation assay. Histone humanization in the scc4
D65Y genetic background results in persistent aneuploidy (red chromosomes), does the presence of a second mutation, DAD1
E50D or DAM1
N80Y, stop the accumulation of aneuploidies to maintain euploidy (gray chromosomes)?
DASH mutants increase histone humanization in the scc4
D65Y background. Humanization rates of the scc4
D65Y mutant with and without DAD1
E50D or DAM1
N80Y. The significance of the mean difference in 5‐FOAR frequency was determined with the Mann–Whitney test. Each dot represents one biological replicate (n = 8), the central band represents the median, the box extends from the 25th to 75th percentiles, and the whiskers represent the minimum and maximum.
Ploidy analysis by flow cytometry in the scc4
D65Y humanized mutants from panel (D). Flow cytometry data from humanized lineages yHs5 and yHs7 are shown for aneuploid and euploid controls, respectively.

