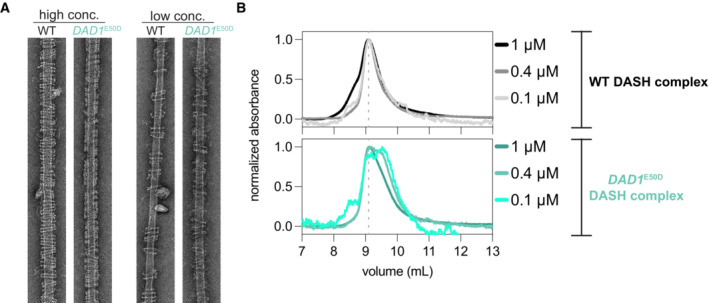
Figure EV5. DAD1 E50D disrupts DASH/Dam1c oligomerization and reduces its dimerization.

- Example EM images of DASH rings taken at low and high concentrations. High concentration > 25 nM complex and low concentration 11–16 nM complex. Microtubules are at a concentration of 20 nM tubulin dimer.
- Size exclusion chromatography of WT (upper graph) and mutant DAD1 E50D (lower graph) DASH complexes. Three dilutions of the DASH complex are shown. SEC analysis at lower concentrations of the mutant complex, but not for the WT complex, reveal the emergence of a second peak due to a species with a lower apparent molecular weight.
