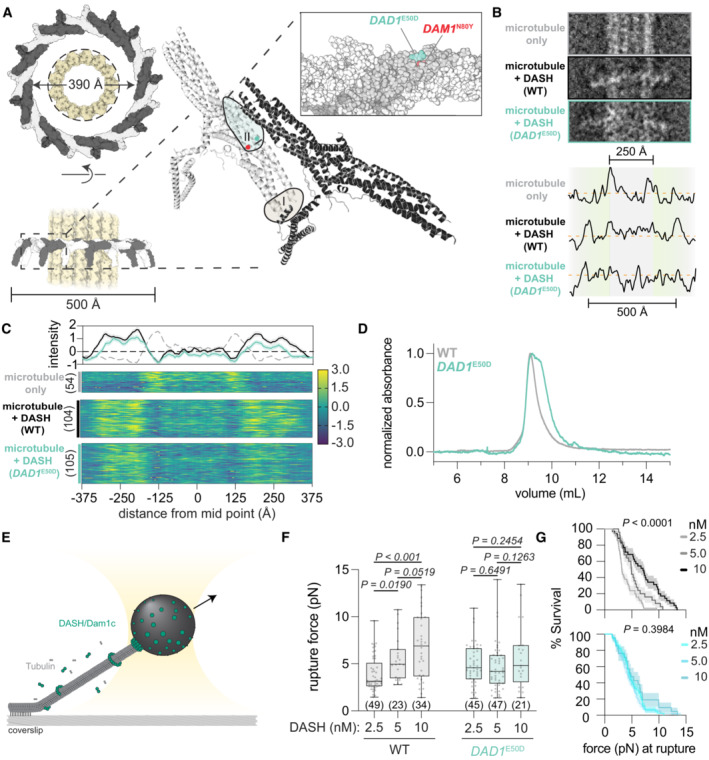
Structure of the 17‐member DASH/Dam1c ring of C. thermophilum around a microtubule lattice is shown (6CFZ and 5SYF, respectively). The ring, with a 390 Å interior circumference, encircles a single microtubule with a width of 250 Å (dashed line). Individual protomers oligomerize through interactions of two conserved interfaces, with the DAD1
E50 and DAM1
N80 residues highlighted in the zoomed‐in region of interface II.
Analysis of DASH complex rings around microtubules. Top, example images are shown for the three cases measured (bare microtubules, WT DASH, and DAD1
E50D DASH). The bare microtubule lattice was measured from the same micrographs with a DASH complex present, where sections that showed no DASH complex were measured. Below the z‐score normalized pixel intensities for the example EM micrographs. Note the increased intensity outside the range of the diameter of the microtubule lattice for samples with the DASH complex.
Heatmaps show the z‐score normalized pixel intensities along a straight edge bisecting the width of the microtubule or microtubule + DASH complex. The number of particles analyzed is shown in parentheses. Above are the average profiles of pixel intensity with 95% CI. The dashed gray line is the average profile of pixel intensity of bare microtubules.
Size exclusion chromatography of the indicated DASH complexes.
Schematic of the optical trap experiment with wildtype and mutant DAD1
E50D DASH complex on microtubules.
Rupture force assay from experiments at three concentrations of DASH complex incubated with the beads. Briefly, 3.5 pM of beads were incubated with the indicated concentrations of DASH complex (representing a ratio of DASH complex to beads of 714:1, 1,428:1, and 2,860:1). These DASH‐decorated beads were then washed before suspending in a reaction mix containing free tubulin and 5 nM free DASH complex. Two‐way ANOVA tests of the mean difference in rupture force are shown with multiple test corrections (false discovery rate). Each dot represents an individual rupture force measurement (n ≥ 21; the exact number shown below each box between parentheses), the central band represents the median, the box extends from the 25th to 75th percentile, and the whiskers represent the minimum and maximum.
Survival curves for each DASH complex are shown at the indicated concentrations. Log‐rank tests were performed to test whether the survival curves were significantly different from one another. Error bars represent the standard error and are displayed as the shaded area.

