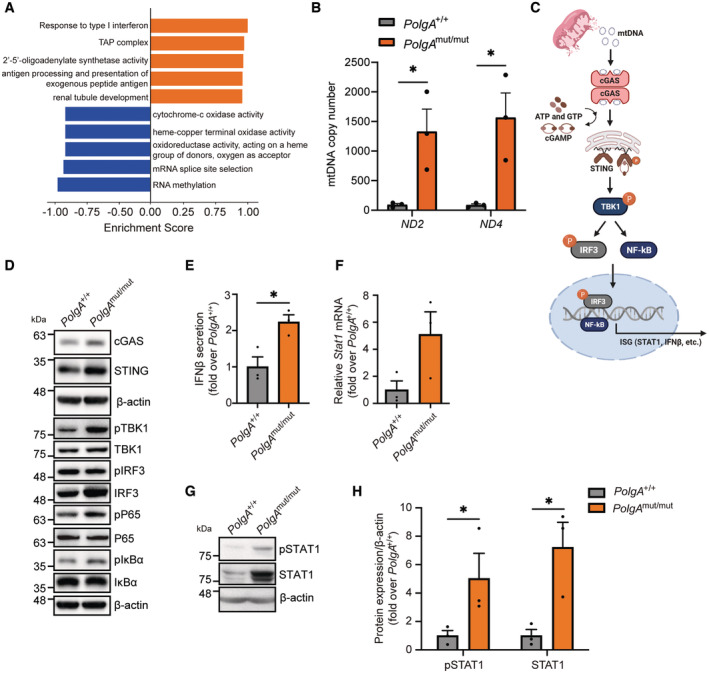
Figure 2. Activation of the cGAS/STING pathway in PolgA mut/mut cells.

- Gene annotation enrichment analysis showing the top five upregulated (orange) and downregulated (blue) GO terms in a data set obtained from proteomic analysis of total protein extracts of PolgA mut/mut (n = 4) and PolgA +/+ (n = 3) cells.
- Absolute quantification of the cytoplasmic mtDNA genes Nd2 and Nd4 in PolgA +/+ and PolgA mut/mut cell lines.
- Scheme of cGAS/STING pathway activation upon mtDNA sensing (Created with BioRender.com).
- Representative Western blots for the analysis of the cGAS/STING signaling pathway in PolgA +/+ and PolgA mut/mut cells with β‐actin serving as loading control.
- Secreted IFNβ in supernatants from three distinct PolgA +/+ and PolgA mut/mut cell lines. The 15.81 pg/ml detected by ELISA in PolgA mut/mut cell supernatants corresponds to 18.97 IU/ml recombinant mouse (rm) IFN‐β according to the R&D Systems cytokine conversion table (https://www.rndsystems.com/cn/resources/technical‐information/unit‐conversion‐table).
- RT‐qPCR analysis of Stat1 in three different PolgA +/+ and three PolgA mut/mut cell lines.
- Western blot analysis of pospho (Tyr701)‐STAT1 and STAT1 with β‐actin as loading control in PolgA +/+ and PolgA mut/mut cells.
- Densitometric analysis of pSTAT1 and STAT1 expression normalized to β‐actin and set to 1 in three PolgA +/+ or three PolgA mut/mut cell lines.
Data information: Data are shown as the mean ± SEM of three biological replicates and were analyzed with two‐tailed unpaired Student's t‐test. Asterisks indicate significance as *P < 0.05.
Source data are available online for this figure.
